

Swing Trading · Lesson 03 of 15 · Reviewed November 10, 2026
A chart compresses transactions into a visual summary. Before interpreting a trend, identify what each bar represents, which sessions are included, and whether the current bar is complete. A daily chart and a weekly chart answer related but different questions. Combining them is useful only when the role of each timeframe is stated before the outcome becomes visible.
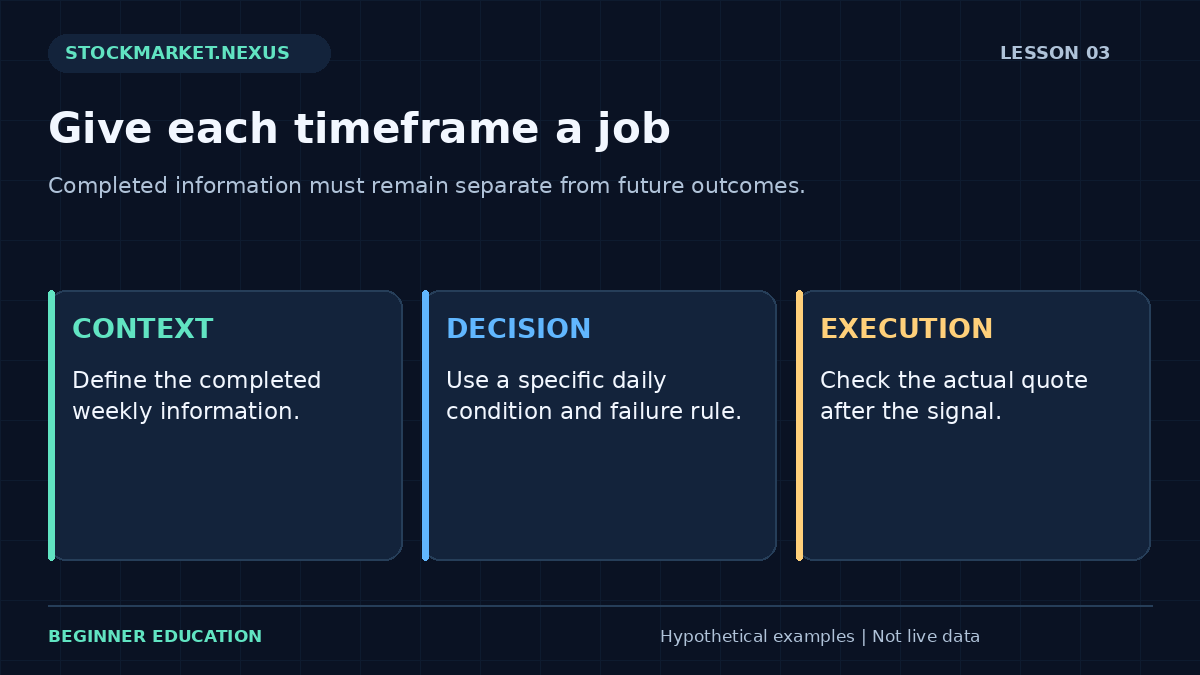
For a beginner's exercise, assign the weekly chart a contextual role and the daily chart a decision role. That is one possible arrangement, not a universally superior method. The key is that the arrangement remains stable. If a daily setup fails, switching to a favorable monthly chart does not preserve the original hypothesis; it changes the question being asked.
1. Establish the chart's data contract
Record the symbol, listing, data vendor, time zone, and adjustment settings. Confirm whether prices are adjusted for splits or distributions and whether the display includes extended-hours activity. Two charts can disagree because their settings differ rather than because one is necessarily wrong. Do not interpret a settings mismatch as new market information.
A bar's open, high, low, and close summarize a defined interval. The high and low do not reveal the exact path between them. If both a target and a stop lie inside the same daily range, that bar alone does not establish which was reached first. A study must use finer data or an explicit conservative ambiguity rule.
The stock quote foundation helps distinguish a displayed last price from an executable quote. Chart values are observations about a data series; an actual instruction still interacts with available prices and the broker's order rules. Keep the chart record separate from the execution ledger.
2. Describe weekly context using completed information
A completed weekly sequence may show rising highs and lows, a broad range, or a declining structure. State the observation without turning it into a prediction. A rising sequence can later reverse. A range can persist longer than expected. The chart provides a framework for a hypothesis, not a contract about the next bar.
During the week, the current weekly bar is still changing. A Thursday afternoon view cannot use Friday's eventual close as confirmation. If a method permits decisions from an incomplete weekly bar, describe that explicitly. Otherwise, use the last completed weekly bar for the context check and preserve the current partial bar as a separate observation.
Avoid making the weekly view so broad that it can justify every daily outcome. A useful contextual rule should be capable of excluding a candidate. For example, the exercise might require that a specified completed weekly support area remains intact. A rule that changes whenever price approaches it is difficult to evaluate.

3. Define the daily structure independently
On the daily chart, identify the particular setup being studied. A consolidation, a pullback, and a breakout are different structures. Mark the relevant observation window and the prices used to define it. The reason for selecting those boundaries should be visible from information available at that time, rather than from a later successful move.
Use zones when the evidence does not justify a precise cent. Repeated reactions around $40 do not necessarily establish that $40.00 is a uniquely meaningful boundary. Precision in an order ticket is necessary, but precision in the story should match the quality of the observation. A narrow line can create false confidence about an inherently approximate area.
The support and resistance guide develops this distinction. In the current exercise, the chart annotation should identify what would count as remaining inside the structure and what would count as failure. Without a failure definition, a pattern can be redrawn indefinitely.
4. Decide what happens when timeframes conflict
Suppose the weekly view is rising while the daily chart has broken the intended pullback boundary. The weekly context does not automatically override daily invalidation. If the plan assigned the daily chart responsibility for the trade's failure condition, that condition remains relevant. A larger timeframe can explain context without granting permission to ignore the operating rule.
Write a conflict policy before studying examples. One policy may exclude trades when the daily and weekly conditions disagree. Another may allow a smaller research universe under a specific countertrend method. Those approaches create different samples. Mixing them after seeing results makes it impossible to tell which method generated the observed outcome.
For beginners, a simple pass rule can be easier to operate than a complex exception tree. Simplicity is not proof of profitability, but it makes execution and review more inspectable. The immediate learning objective is to apply one stable set of definitions, including its exclusions, across both favorable and unfavorable charts.
5. Separate an observed close from the next entry
A completed daily close may satisfy a chart condition, but the next executable price can differ. If a fictional stock closes at $50.20 above a $50 boundary and opens next morning at a $52 ask, an entry at $50.20 cannot be assumed merely because that was the signal price. The market has supplied a different execution opportunity.
Set an acceptable entry boundary and recompute the trade when the actual quote changes. A $49 intended exit creates $1.20 of price distance from $50.20 but $3 from $52. A target at $54 provides $3.80 of potential upside from the first price and only $2 from the second. These are different trade geometries before costs.
The swing breakout lesson explains how to preserve signal and fill records separately. A missed execution is part of the method's evidence. It should not be converted into an idealized completed trade simply because the subsequent chart looked favorable.
6. Annotate charts so another person can audit them
Save an image with a visible timestamp and enough prior context to justify the selected boundaries. Label completed and incomplete bars. Note any data adjustment that changes the historical series. A close-up that removes earlier failures can make an ordinary pattern appear much cleaner than it was in the actual decision environment.
Use a small number of annotations with explicit meanings. One color can mark the observation zone, another the permitted entry boundary, and another the planned invalidation. Avoid drawing several alternatives and later presenting only the line that happened to match the outcome. Preserve the original chart alongside any later review version.
Review a sequence of candidates, not just a collection of attractive examples. Include charts that never triggered, triggered without an eligible fill, or failed after entry. The swing-trading journal lesson explains how those categories fit the performance record without manufacturing returns for unexecuted ideas.
Work through an ambiguous daily bar
Assume a fictional position has an intended $48 protective trigger and a $54 target. A later daily bar reports open $51, high $55, low $47, and close $52. Both levels lie inside the reported range. The bar establishes that the range included those prices in the data series, but it does not establish the order in which the target and trigger were encountered.
A study that always assumes the target happened first gives the method an advantage unsupported by the bar. A study can use finer timestamped data if available, or apply a clearly stated ambiguity convention. The convention should be selected before reviewing outcomes and used consistently. It should not switch according to whether the resulting trade would be more attractive.
Even finer trade data may not reproduce the account's executable quote, queue, or supported trigger standard perfectly. State what the data can establish and what remains modeled. The practical lesson is to avoid using more precision in the reported result than the evidence supports. An uncertain sequence should remain labeled uncertain instead of being converted into a confident profit figure.
Compare adjusted and unadjusted chart histories
Corporate actions can change the historical price series shown by a vendor. A split adjustment, for example, can rescale earlier prices so the series remains comparable across the action. A distribution adjustment can also alter historical levels depending on the vendor's convention. The displayed old value may therefore differ from a price recorded on an original decision card.
Before interpreting the discrepancy as a recordkeeping error, compare symbol identity, adjustment settings, and data versions. Preserve the original execution price in the ledger. Chart adjustments do not rewrite the cash actually paid or received in the account. If a study uses adjusted prices, its quantity and return calculations need a consistent treatment of the corresponding action.
For a beginner's manual exercise, the simplest control is a settings note saved with each chart. Include whether the series is adjusted, the timeframe, and the source. This makes later comparisons more intelligible. It also prevents a changed display from being used as evidence that the trader should have recognized a different historical support level at the original decision time.
Give each timeframe a job and a stopping rule
A two-timeframe method can assign weekly context to candidate eligibility and daily structure to entry and invalidation. Under that arrangement, the weekly chart answers whether the candidate belongs in the study, while the daily chart answers whether the specific trade condition exists. An additional intraday view may help inspect execution, but it should not quietly redefine the setup.
Write what happens when one view changes before the other. If weekly eligibility disappears, does the method stop new entries, review existing holdings, or both? If daily invalidation occurs while weekly context remains favorable, which rule governs the open trade? These questions should be answered before examples are selected. Otherwise, disagreement between charts becomes an unlimited source of exceptions.
A useful stopping rule is that unresolved conflict produces observation rather than a forced instruction. This is an operating choice, not proof of a profitable strategy. Its benefit in a learning exercise is that it prevents the chart reader from searching more intervals until one supports the desired action. A method must be able to exclude a trade without needing to explain the entire market.
Audit a chart decision in reverse
Start with an actual or fictional execution record and work backward. Identify the price and quantity that filled, then locate the decision timestamp, the signal observation, and the chart context that existed before the signal. Every step should have its own evidence. If the chain jumps directly from a later winning chart to an assumed earlier fill, the record is incomplete.
Ask whether a person following the stated routine could have seen and acted on the condition. A signal finalized after the close cannot authorize a fill earlier that afternoon under the same close-based rule. A person unavailable until the next evening cannot assume the next morning's best quote. These are feasibility questions, not criticisms of the chart pattern itself.
Conclude with a short reconstruction: what was known, what was allowed, what was submitted, and what filled. If any component is missing, label it rather than guessing. This disciplined reconstruction makes the chart a useful piece of evidence in a complete trading record instead of a visual story that becomes more persuasive each time the outcome is retold.
## Worked exercise: three timestamps, one rule
Choose a fictional completed weekly context with a rising sequence and a daily consolidation between $47 and $50. At Monday's close, the daily close is $49.80. At Tuesday's close it is $50.20. Wednesday's first available ask is $52. Write the decision at each timestamp using only the information then available.
A close-based breakout rule cannot claim confirmation on Monday. It can identify a signal on Tuesday if the rule's other conditions hold. Wednesday still requires an execution check. If the maximum entry is $50.60, the $52 ask is outside the plan. The correct record is a signal without an eligible opening execution, regardless of what Thursday's chart later shows.
Now change the Wednesday ask to $50.40 and the intended exit to $48.90. Calculate the $1.50 distance per share and the purchase cash for a sample quantity of 20 shares. Record the $30 planned price loss and $1,008 purchase value separately. The exercise connects chart interpretation with the account mechanics that an actual trade requires.
## Sources and further reading
Chart interpretation background provides background for the concepts discussed. All numerical cases and worksheets in this lesson are original fictional illustrations, not historical performance results.