

Swing Trading · Lesson 15 of 15 · Reviewed November 10, 2026
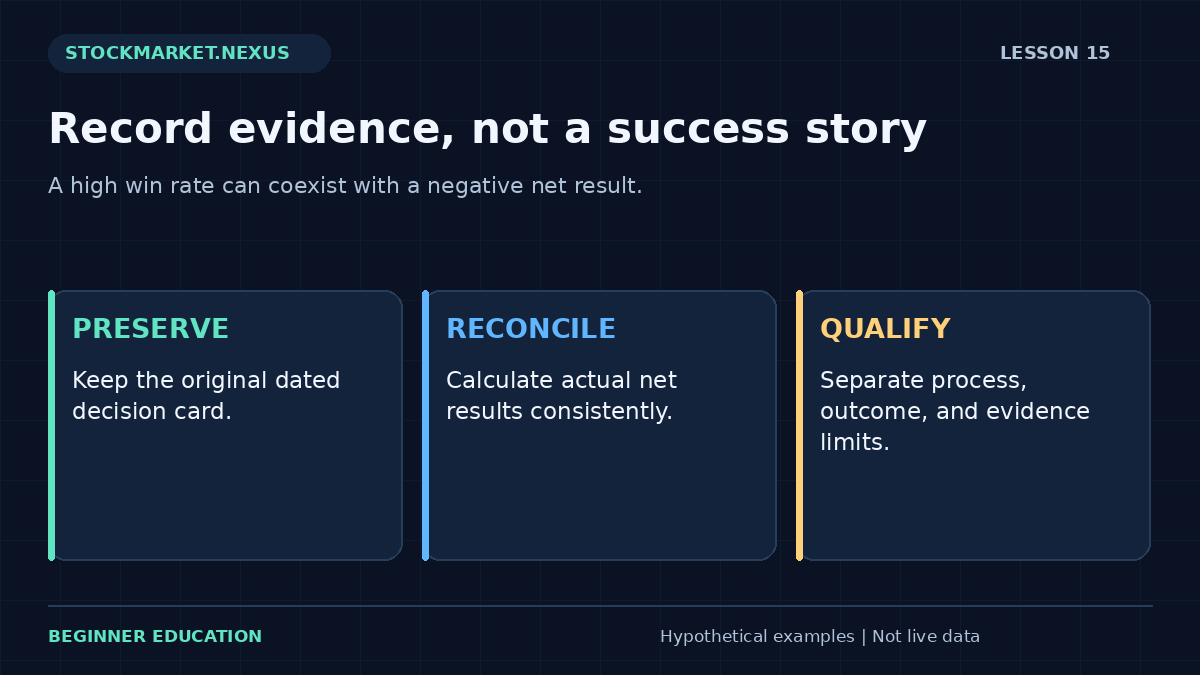
A trading journal should allow another reader to reconstruct the decision sequence. It needs more than a screenshot and a profit number. For swing trading, the record spans several sessions, changing event information, order updates, partial fills, and overnight exposure. Preserving those details makes it possible to evaluate what the method actually required.
The first objective is accuracy, not a flattering performance summary. A small set of profitable trades can contain poor execution or large unobserved risks. A losing sequence can include correctly followed rules. Separate the market outcome, the operator's behavior, and the quality of the evidence before drawing a conclusion about the method.
1. Preserve the original decision card
Store the hypothesis, entry condition, maximum acceptable price, intended exit, quantity calculation, event check, and review deadline before the outcome is known. Add a timestamp and the relevant chart settings. Later commentary should be stored alongside that original record rather than overwriting it.
A revised explanation can be useful if labeled as a review. It becomes misleading when presented as the reason that existed before entry. The journal's value comes from distinguishing those stages. A compelling story written after a profitable move is not evidence that the decision process could have identified it prospectively.
The complete swing-trading guide provides the decision-card fields. Start with a small number of consistent fields that will actually be completed. A complex template abandoned after two trades contributes less evidence than a concise record maintained carefully.
2. Record signals, orders, and fills separately
A chart condition can occur without an eligible entry. An eligible order can remain unfilled. A requested quantity can fill only partially. These outcomes should not be collapsed into one trade category. The journal needs a status sequence that reflects what the account actually did.
For a completed holding, retain every execution quantity, price, timestamp, and applicable explicit charge. Calculate weighted entry and exit values from those fills. A single best price shown on the chart cannot be applied to the entire position. Reconcile remaining orders before labeling the trade closed.
The exit planning lesson explains why partial sales require updated quantities. The journal should make those intermediate states visible, especially when a position remains exposed overnight after an incomplete exit.
3. Calculate net results consistently
Choose a convention for price movement and costs. If actual execution prices already include spread effects, do not subtract the same spread again. Subtract explicit charges separately and label any other modeled costs. A consistent convention is necessary before averages or comparisons have a stable meaning.
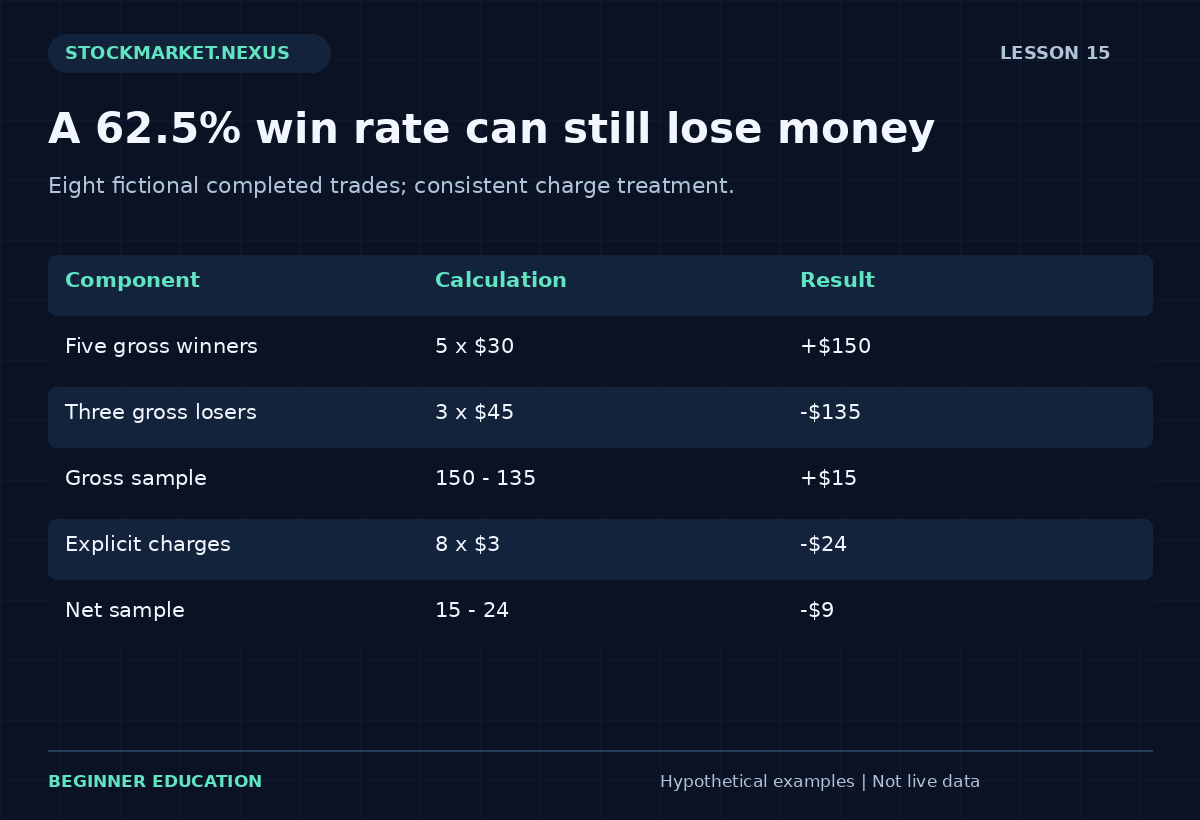
Consider eight fictional completed trades: five gain $30 each before explicit charges, and three lose $45 each. Gross gains total $150, gross losses total $135, and gross result is $15. If charges total $24, net result is minus $9. A 62.5% win rate does not make this sample profitable.
Average net result is minus $9 divided by eight, or minus $1.125 per trade under that record. This is a description of the sample, not a forecast of the next trade. Small samples and changing conditions limit what can be inferred. Arithmetic accuracy should not be confused with statistical confidence.
4. Track drawdown from the account's running peak
Drawdown describes a decline from a prior peak in the chosen equity series. State whether the series includes unrealized marks, only closed trades, deposits, withdrawals, and charges. Different conventions can produce different numbers. A closed-trade curve may conceal adverse movement inside positions still held overnight.
For a fictional net-equity sequence of $5,000, $5,100, $5,040, $4,950, and $5,020, the peak before the decline is $5,100. The trough is $4,950, a $150 decline. Dividing $150 by $5,100 gives about 2.94%. The later $5,020 value has not yet regained the previous peak.
The portfolio heat lesson addresses planned exposure before outcomes occur. Drawdown measures an observed path afterward. They answer different questions. A modest historical drawdown does not prove that the current account has a similarly modest adverse scenario.
5. Classify process compliance independently
Use specific labels such as entry outside boundary, missed event check, unauthorized addition, unverified cancellation, or compliant execution. Avoid a single emotional score that changes with the result. Each label should refer to an observable rule. The review can then count recurring issues without inventing a psychological explanation for every trade.
A profitable violation remains a violation under the defined method. A compliant loss remains part of the method's outcome sample. Keeping those categories separate allows two questions to be studied: how the rules behaved when followed, and how actual behavior differed from them. Combining the questions obscures both.
Also record justified passes and no-fills. These do not create realized trading profit, but they describe opportunity frequency and operational feasibility. A method that appears attractive only when every signal is assumed filled may look different once actual price boundaries and availability are respected.
6. Protect the review from hindsight and selection bias
Choose the evaluation window and inclusion rules before examining results. Include failed candidates, unfavorable periods, and securities that later became unavailable if they belonged to the original universe. A collection of surviving winners cannot establish how the process would have behaved across the original opportunity set.
If a rule is changed during development, label the version and avoid presenting all earlier results as evidence for the final version. Preserve separate development and later evaluation records where possible. Repeatedly tuning the same examples can fit noise while producing a persuasive historical narrative.
The Swing Trading Practice Lab can support timestamped decision rehearsal with fictional data. Repeating a known path can help learn mechanics, but it is not an independent performance test. Once the future sequence is remembered, the exercise no longer measures decisions under the same uncertainty.
Use risk units without hiding gap losses
A journal may express a trade's net result relative to its original planned allowance. If a fictional trade planned $50 of price loss and later realizes a $125 price loss, the price result is minus 2.5 times that original allowance. The notation can help compare scale, but it should not imply that losses cannot exceed one unit.
State whether the denominator includes costs and whether it is fixed at entry. Replacing the original denominator after a loss can make the result look less severe. Retain the entry-time definition and report actual dollar results alongside the normalized figure. This preserves both comparability and the economic consequence for the account.
Do not assume equal units imply equal adverse distributions. Two trades can share a $50 intended-exit allowance while facing different event and liquidity conditions. Risk-unit notation summarizes an assumption; it does not remove the need to examine the holding's actual gap scenarios, cash commitment, and portfolio overlap.
Distinguish time-weighted questions from trade-count questions
Average result per trade describes one aspect of a sample. It does not account fully for how long cash was committed or whether positions overlapped. A method with a small number of long holdings can differ materially from one with many brief holdings, even when their average trade results look similar.
Record entry and final-exit dates and identify overlapping exposure. This helps explain the account path and the operating workload. If one trade remains open through several other completed trades, a closed-trade-only sequence can conceal its unrealized changes. An account-equity view and a trade ledger provide complementary evidence.
For a beginner's review, avoid inventing an annualized return from a tiny practice block. State the observed dates, number of completed trades, costs, and valuation convention. The sample can teach whether the records reconcile and whether the routine is feasible without supporting a precise forecast about a full year's results.
Separate deposits from performance
Cash added to the account increases its balance without being a trading gain. Withdrawals reduce the balance without necessarily being a trading loss. A performance record should identify those external flows so they do not distort the interpretation of the equity series. A simple beginning-versus-ending comparison can be misleading when flows occur between them.
For a fictional example, an account starts at $5,000, receives a $1,000 deposit, and ends at $5,900. The $900 balance increase does not mean trading earned $900. Under a simplified no-other-flow convention, the result after the deposit is a $100 decline relative to the $6,000 funded amount. More detailed performance measures require explicit timing conventions.
Keep the external-flow ledger separate from execution records while reconciling both to the account. This makes it easier to identify missing charges or an unrecorded holding. Accurate reconciliation is a prerequisite to interpreting a return metric. A sophisticated statistic cannot repair an account history whose basic cash movements are incomplete.
Identify which errors the data can actually establish
A journal can show that an entry exceeded its written boundary or that an event check was missing. It may not establish the operator's psychological motive. Avoid turning every deviation into a confident diagnosis of fear, greed, or overconfidence. Observable behavior is enough to support a concrete process correction.
Similarly, an unexpected loss does not prove that information was ignored. Compare the original source record with later changes. If the event was genuinely unannounced, label the surprise rather than inventing a missed warning. Honest classification makes the review more useful and reduces the temptation to explain every outcome as though it had been obvious.
Use a small set of clear error categories with examples. Review borderline cases consistently and retain uncertainty where the evidence is incomplete. The objective is a reliable operating record. A journal that always produces a perfect explanation can be less informative than one that clearly distinguishes what is known from what remains unresolved.
Design the next practice block prospectively
Choose the next block's candidate universe, dates, rules, cost assumptions, and review questions before collecting outcomes. Preserve its version label. If a material rule changes during the block, document the change and avoid combining all results as though one stable method generated them. The record should show the actual development process.
Include no-trade observations and eligible signals without fills. These categories help measure opportunity frequency and feasibility, even though they do not create realized account returns. A method that depends on rare idealized executions should be described differently from one that produces frequent usable opportunities under the stated constraints.
At the end, summarize the evidence proportionally: mechanics completed, records reconciled, specific deviations observed, and remaining questions. A fixed practice block can demonstrate learning and reveal weaknesses. It cannot certify readiness for real-money risk or establish that a small favorable sample represents a durable trading advantage.
## Worked exercise: an honest eight-trade review
Create eight rows with the five $30 gross gains and three $45 gross losses described earlier. Allocate $3 explicit charges to each completed trade. Net winners are $27 each, net losers are minus $48 each, and total net result is $135 minus $144, or minus $9. Verify the result from both row totals and aggregate arithmetic.
Now label one winner as an entry outside the permitted boundary and one loser as a missed event check. Keep their actual results in the account record, but create a separately labeled process analysis. Do not simply delete the inconvenient rows and call the remainder the strategy's true performance. Explain any filtered analysis and its limited purpose.
Finally, write one improvement question for the next fixed practice block. It might ask whether entry boundaries can be applied consistently or whether event verification can be completed within the available routine. The next block should test that specific behavior without claiming that a cleaner checklist guarantees profitable trading.
## Frequently asked questions
Does a high win rate establish a profitable method? No. The size of wins and losses, charges, execution, and sample composition all matter. Reconcile the complete net ledger before interpreting the frequency of profitable trades. A few large losses or repeated friction can outweigh many small gains, and a small sample still limits broader conclusions.
Can a known replay path measure predictive skill? It can teach mechanics and help rehearse records, but remembered future prices change the information problem. Label repeated-path practice accordingly. For later evaluation, use prospectively defined examples and preserve decisions before revealing outcomes. A simulation score should not be presented as certification of trading readiness or expected returns.
## Sources and further reading
Order and execution foundations provides background for the concepts discussed. All numerical cases and worksheets in this lesson are original fictional illustrations, not historical performance results.