

Swing Trading · Lesson 04 of 15 · Reviewed November 10, 2026
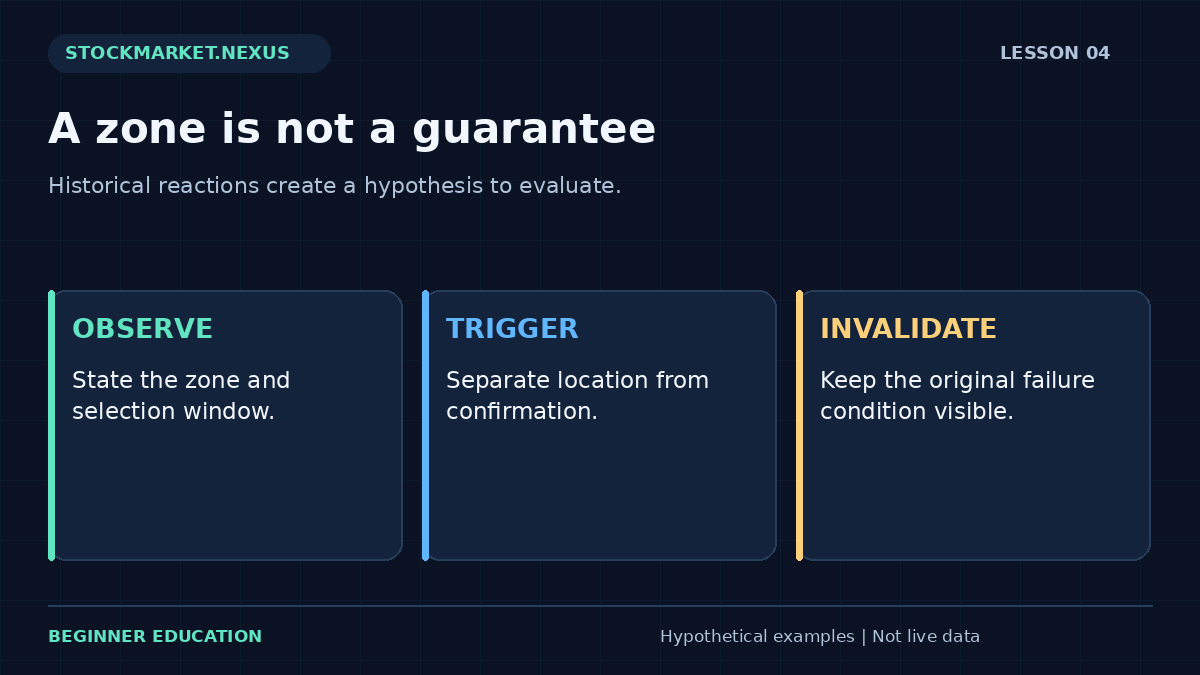
Support and resistance describe areas where price has previously encountered buying or selling pressure. They are observations about history, not physical barriers. A price can reverse near a marked area, move through it, gap beyond it, or remain nearby without producing an executable opportunity. The useful question is what a particular plan will do under each condition.
For swing trading, the holding window adds time for the surrounding information to change. A zone marked on Friday can be crossed by Monday's first quote after an unexpected announcement. Treat the chart as one part of a conditional plan. The instrument, current quote, event calendar, quantity, and intended exit remain separate checks.
1. Select the observation window honestly
State why the chosen price history is relevant. A method might use the most recent completed consolidation, a prior daily swing, or a clearly defined weekly area. These are different definitions. Decide which one applies before inspecting the later result, and retain the original chart so the boundary cannot quietly migrate.
A zone drawn from two isolated reactions is not equivalent to one formed during a sustained range. Neither automatically predicts success. The evidence should be described at its actual strength. Avoid giving a line a dramatic name that implies more certainty than the observations support. A label is a convenient reference, not a statistical finding.
The daily and weekly chart guide explains why incomplete bars and mixed timeframes complicate the record. Support on one interval may lie inside ordinary fluctuation on another. Keep the relevant timeframe visible whenever the zone is used to justify a decision.
2. Distinguish the zone from the entry trigger
A stock reaching an area of previous support is a location event. An entry trigger requires an additional stated condition if the method uses one. That condition might involve a completed close, a defined rebound, or another observable event. The location and trigger should not be collapsed into the vague instruction to buy when it looks strong.
Consider fictional support between $39.50 and $40. A quote at $39.80 establishes that price is inside the area. It does not establish that selling has ended. If the rule requires a completed daily close above $40.20, that information is unavailable earlier in the session. A later rebound cannot justify claiming that confirmation existed at the earlier quote.
The pullback lesson shows how a location can remain interesting without authorizing an instruction. Preserving that intermediate status is useful. It allows the research process to say observe rather than forcing every chart into the binary categories of buy now or ignore forever.
3. Write a failure definition that can actually fail
A support-based hypothesis needs an invalidation rule. The rule might refer to an intraday price, a completed close, or a broader structural change. Those choices have different consequences. A close-based rule can allow a larger intraday adverse move than an immediate trigger. Do not present them as interchangeable merely because they use a similar chart area.
An intended protective order and a thesis-review rule can coexist, but their relationship must be clear. If a broker stop can close the position before the end-of-day review, the journal should record that actual execution. The later close does not undo it. Conversely, a mental review threshold is not an active broker instruction.
Do not widen the boundary simply because the current position would otherwise be closed. If the method permits a predefined adjustment, record its rule and effect on total exposure. If it does not, moving the boundary changes the method. A trade's disappointing outcome does not create new evidence that the original zone was drawn too narrowly.
4. Measure the available space without inventing a target
A prior resistance area can provide a reference for evaluating a long trade, but price is not required to reach it. Describe the target as a conditional exit objective. Avoid writing that the stock has a certain amount of guaranteed room or must revisit its former high. Chart geometry supplies distances, not probabilities.
Suppose an entry is $40.50, the intended exit is $39, and an objective is $43.50. Planned downside is $1.50 per share and the target distance is $3. The gross distance ratio is two to one. This does not mean the trade wins twice as often or has a positive expected result. Frequency, execution, costs, and failure behavior are separate evidence.
The exit planning lesson develops target, trailing, and time-based decisions. For the current chart exercise, the important task is to avoid using an attractive ratio as a substitute for a complete plan. A mathematically neat distance can still describe an impractical or untested trade.
5. Account for zones that change roles
Traders sometimes describe old resistance as possible new support after a breakout. That is a hypothesis to observe, not a mandatory market behavior. A retest can hold, fail, never occur, or happen at a price outside the permitted entry. Define which of those sequences the method accepts and how it records the others.
Do not add a retest requirement after a failed breakout merely because waiting would have improved that example. Equally, do not remove the requirement after a breakout that never returned. Those are different methods. A fair comparison uses fixed definitions across a sequence of examples rather than selecting whichever rule fits each completed chart.
Keep expiration in the plan. A zone observed several weeks earlier may no longer be the relevant structure after a new consolidation or major announcement. Expiration does not mean the old prices become meaningless; it means the original decision card no longer automatically governs a new opportunity.
6. Practice with uncertainty instead of perfect reactions
Use the Swing Trading Practice Lab to observe prices one session at a time. Before revealing the next session, state whether the current quote is inside the observation area, whether the entry trigger is complete, and whether any existing holding remains within its planned rules. Keep those three answers separate.
For a fictional 20-share position entered at $40.50, compare an intended $39 exit with an available $37.80 sale after a gap. The price loss changes from $30 to $54 before charges. The support zone has not prevented the extra $24. This arithmetic is a reminder that chart boundaries and execution outcomes describe different parts of the process.
Then create a favorable scenario that reaches $43.50 and a stagnant scenario that remains near entry until the review deadline. Write the action for each before revealing it. A complete support-and-resistance exercise includes failure and inactivity; a gallery of perfect rebounds teaches only how to recognize outcomes after they have happened.
Compare an intraday breach with a closing breach
Suppose a fictional support zone extends from $39.50 to $40. During one session, the reported low is $39.20 and the close is $40.30. A rule that treats any intraday breach below $39.50 as invalidation differs from a rule that requires a completed close below the zone. The same bar can therefore produce different decisions under two legitimate but distinct definitions.
Do not decide which rule was intended after seeing the recovery. The intraday rule may have produced an actual exit before the close, while the close-based rule may have retained exposure through the lower prices. Each has different costs, attention requirements, and adverse paths. Comparing only their final closing values would omit important parts of the experience.
A fair study specifies the trigger standard, execution assumption, and information time for both alternatives. It includes sessions that recover and sessions that continue falling. The purpose is not to find a label that makes every example look correct. It is to establish what each rule would have required when the future path was still unknown.
Understand why a precise line can create false confidence
A charting platform makes it easy to draw a horizontal line at a particular cent. The precision of the drawing tool does not establish the precision of the historical evidence. Repeated reactions across a broad area may justify an observation zone, while a specific order still requires a numerical instruction. Those are separate forms of precision.
Write the observation area first, then explain why the executable trigger or price boundary is placed where it is. The reason might come from a defined method, current execution conditions, or a structural failure rule. Avoid implying that the chosen cent has special predictive power merely because the line appears clean at the current zoom level.
Test the annotation at a reasonable alternative chart scale. If a tiny change in zoom makes the supposed pattern disappear, describe that sensitivity. A study can still use a precise rule, but it should acknowledge that the rule is a convention being evaluated. Visual neatness is not evidence that the market must respect the boundary.
Distinguish a retest from a new setup
After a breakout, price may return toward the former boundary. A method can define a retest window by time, location, and confirmation requirements. If the return happens much later after a different structure has formed, it may no longer belong to the original setup. Define expiration so the same old line does not authorize unlimited future trades.
Consider a fictional breakout above $30, followed by a return to $30.10 the next session. A separate return three weeks later after an earnings release carries a different information context. The numerical level is similar, but the intervening events and price sequence have changed. Treating both as identical retests can hide the role of time and new information.
Keep a setup identifier on the decision card. When the original window expires, archive it and create a new card if a genuinely new opportunity qualifies. This small recordkeeping step makes it harder to recycle an old favorable narrative after its original assumptions have failed. It also helps the journal count independent decisions rather than several reinterpretations of one chart.
Review a failed zone without making it disappear
When price moves through a support area and the position loses, save the original annotation. Record whether the entry, quantity, and exit followed the rules. A failed market hypothesis is not automatically an operating error. Removing the line from the historical chart would erase evidence needed to understand the method's actual behavior.
Next, distinguish possible research questions from immediate rule changes. The review might ask whether the observation window was consistently selected or whether the event policy excluded comparable announcements. Those questions can be tested on a later fixed sample. Simply moving the zone lower after the loss would make the completed example look more reasonable without improving prospective decision quality.
A professional conclusion can remain modest: the defined setup qualified, the trade failed under the recorded execution, and one specific question will be investigated next. There is no need to invent a hidden market motive or claim that the boundary was never meaningful. Honest uncertainty makes the record more useful than a perfect explanation produced only after the result.
## Worked exercise: compare two entries at the same zone
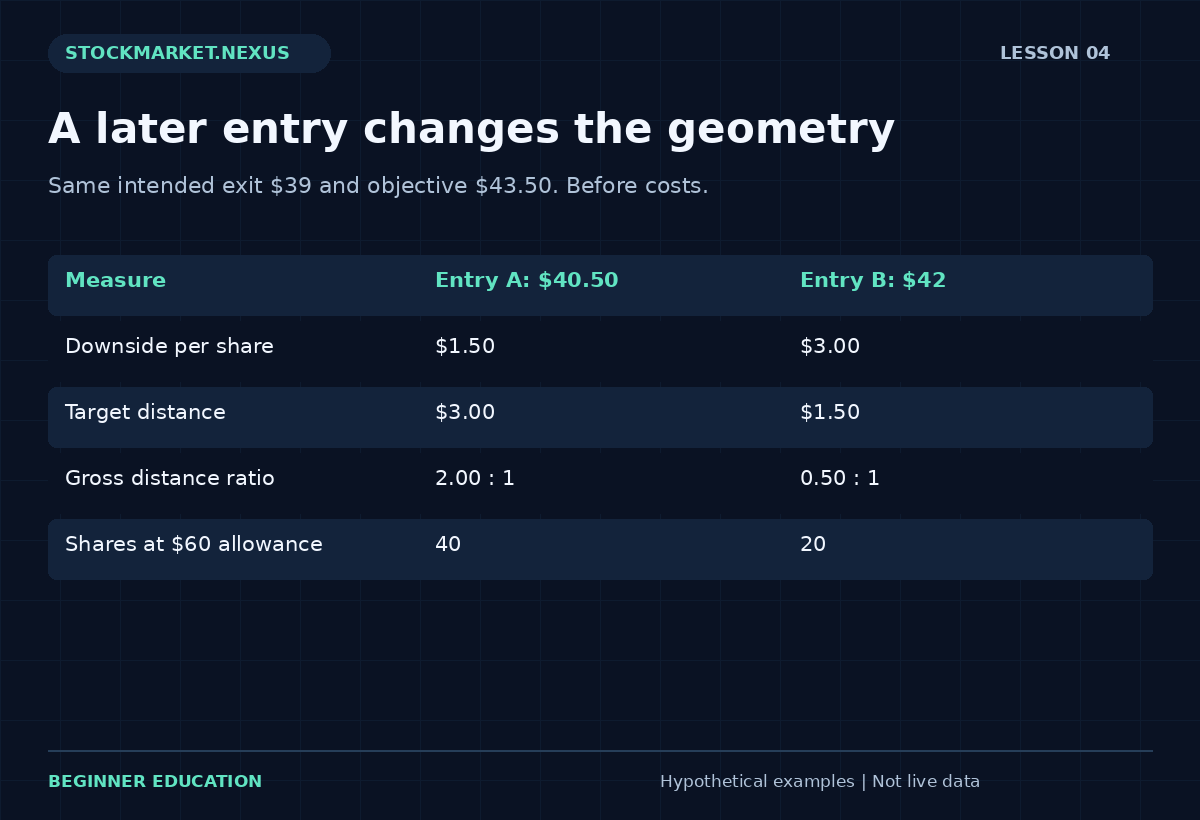
Keep the intended exit at $39 and the objective at $43.50. Entry A is $40.50, while Entry B is a later $42 quote. For A, downside distance is $1.50 and target distance is $3. For B, downside distance is $3 and target distance is $1.50. The same support and resistance annotations now describe opposite gross distance relationships.
If the hypothetical price-loss allowance is $60, the arithmetic quantities are 40 shares for A and 20 for B before costs and cash constraints. Purchase values are $1,620 and $840 respectively. The smaller later quantity does not restore the original opportunity; it only changes dollars exposed under the chosen assumptions. Keep setup quality and size calculations distinct.
Conclude by writing a maximum acceptable entry and a reason for it. The reason should refer to the actual decision framework, such as preserving a minimum distance relationship under a tested method, rather than a belief that an attractive chart deserves any price. A disciplined pass is a valid result when the current quote no longer fits.
## Sources and further reading
Swing-trade chart concepts provides background for the concepts discussed. All numerical cases and worksheets in this lesson are original fictional illustrations, not historical performance results.