

Swing Trading · Lesson 05 of 15 · Reviewed November 10, 2026
A pullback is a move against a preceding direction. In a long-stock swing-trading hypothesis, the idea is often that a temporary decline may be followed by renewed strength. The difficult part is that a temporary pause and the beginning of a larger decline can look similar while they are developing. Naming the move a pullback does not settle that uncertainty.
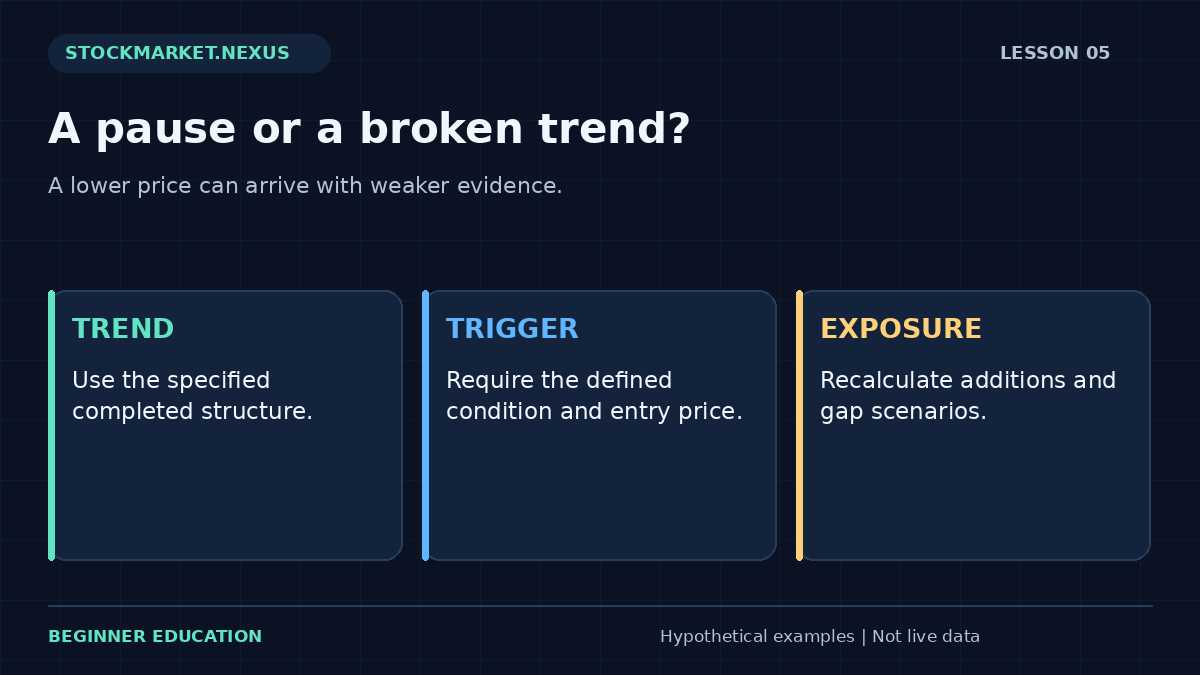
A useful plan describes the prior trend, the area being observed, the condition required before entry, and the evidence that would invalidate the idea. These elements make the hypothesis reviewable even when the trade loses. Without them, every falling price can be described as an increasingly attractive opportunity, and the position can grow while its original reasoning weakens.
1. Define the preceding trend before the decline
Use completed information from a specified timeframe. A rising sequence of daily highs and lows is one way to describe a trend, but the exact rule matters. How many observations are required? What qualifies as a meaningful swing? Does the method use a moving average as context? Write those definitions before choosing examples.
The weekly chart can provide context without overriding the daily setup. If the daily rule fails, a favorable weekly view does not automatically permit continued exposure. Assign responsibility to each timeframe. Otherwise, the plan can search progressively larger charts until it finds one that supports holding a losing position.
The daily and weekly structure lesson explains this separation. For a pullback study, save the chart before the eventual rebound or failure. The original view is the evidence needed to determine whether the trend definition was applied consistently.
2. Identify a location without treating it as confirmation
A prior breakout area, a support zone, or a moving-average region can define where to observe. They do not all carry the same meaning, and none guarantees that a decline ends there. Specify which location rule the method uses. Adding several unrelated references after the fact can make almost any turning point appear planned.
A fictional stock rises from $30 to $36 and retreats toward a prior $33–$34 area. Reaching $34 is a location observation. If the plan requires a completed close above the previous session's high, the location alone is insufficient. The candidate remains under observation until the additional condition occurs or the idea expires.
The support and resistance guide helps turn the area into explicit boundaries. Keep a written distinction between the reason to watch and the reason to act. That single separation prevents many hindsight errors in both paper studies and real decision journals.
3. Choose a trigger with a known information time
A completed daily-close trigger cannot be known at lunchtime. An intraday rebound rule can be observed earlier, but it represents a different method with different false-start behavior. Neither should borrow the other's most favorable entries in a study. Label the trigger and preserve when it became available.
Also distinguish the trigger price from the fill. A close at $34.20 can confirm a condition, while the next available ask is $35.10. The entry-to-exit distance and cash requirement must be recalculated using the executable opportunity. A paper trade filled automatically at the signal close can overstate what the planned operating routine could achieve.
Set a maximum acceptable entry and an expiration. If the stock moves beyond that boundary without offering a valid instruction opportunity, record a missed or ineligible execution. Do not chase the price while retaining the original risk calculation. The later entry is a different trade, even if the chart pattern keeps the same name.
4. Define failure before deciding quantity
The invalidation rule should follow the hypothesis. A price below a relevant structure may undermine the pullback idea, while an arbitrary tiny stop chosen to obtain more shares can lie inside ordinary fluctuation. Conversely, an extremely distant exit can make the quantity or cash requirement unsuitable. These tradeoffs should be visible before entry.
Suppose a fictional entry is $34.50 and the intended protective exit is $32.50. A $50 planned price-loss allowance supports 25 shares before charges. Purchase cash is $862.50. The arithmetic is straightforward, but it depends on the actual intended exit. Changing the exit later requires reconsidering total risk, not merely editing a line.
The sizing and gap-risk lesson adds a worse-exit scenario. At a $30 available sale, those 25 shares lose $112.50 before charges. A protective trigger describes when an instruction activates under its rules; it cannot require the market to supply the originally intended price.
5. Treat additions as new exposure decisions
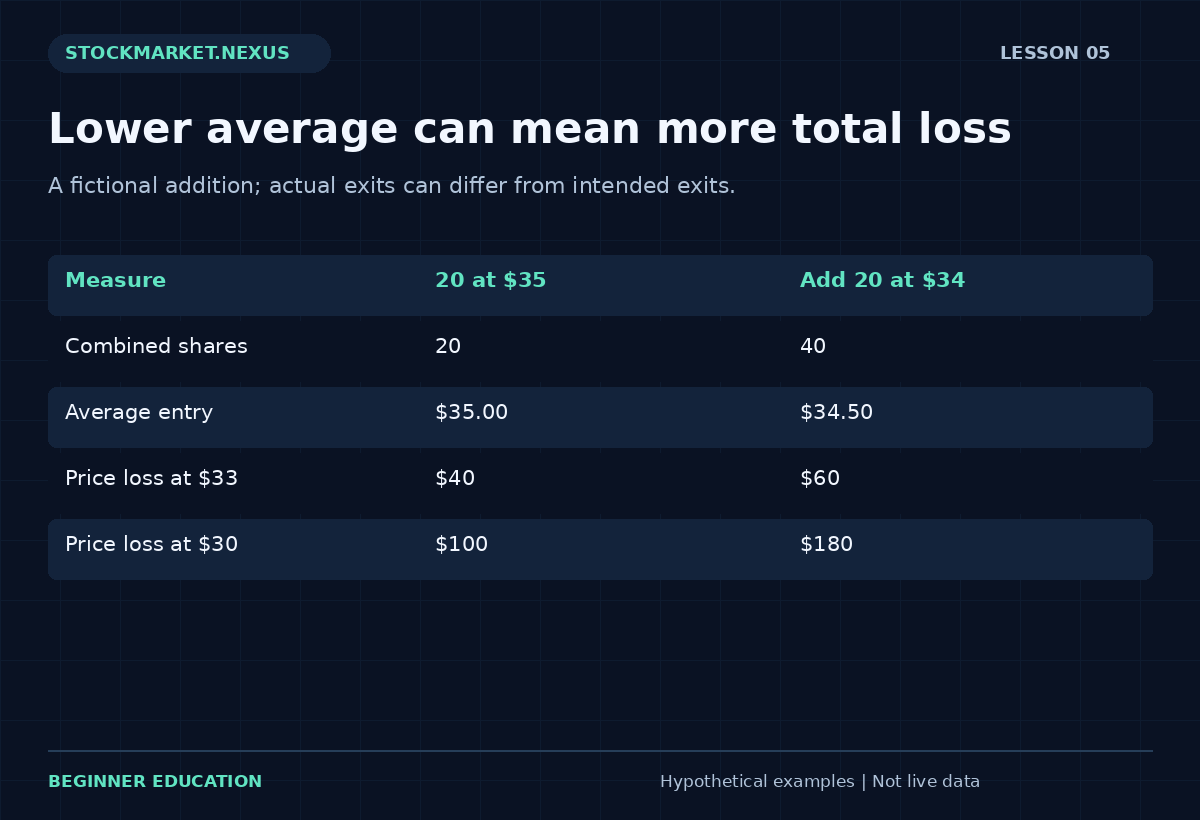
A lower average entry can disguise a larger total loss. Consider 20 shares bought at $35 with a $33 intended exit. Planned price loss is $40. Adding 20 shares at $34 reduces average entry to $34.50 but increases planned loss at the same exit to $60. The lower average is not a complete risk measure.
At a $30 actual exit, the original 20 shares lose $100, while the combined 40 shares lose $180 before costs. The addition changes the dollar consequences of failure. It needs a separate conditional rule, funding check, and portfolio review. Describing the purchase as improving the average does not explain why the added exposure is justified.
If the method does not permit additions, do not introduce them during a drawdown. If it does, specify the maximum combined quantity and the conditions for each step before the first order. A predefined scale-in remains uncertain, but at least its full potential exposure can be evaluated coherently.
6. Evaluate the complete sequence, including no rebound
A fair pullback study includes quick failures, slow failures, rebounds that never trigger, and successful moves with no eligible fill. If only attractive rebounds are collected, the study answers how completed winners look rather than how the method behaves when operated in real time. Candidate selection is part of the evidence.
Track time in the trade as well as price. A position that remains near entry for many sessions uses cash and attention even if its eventual price result is small. A review deadline provides a way to reassess whether the original thesis remains active. It should not be extended automatically each time the deadline arrives.
Use the Swing Trading Practice Lab to rehearse one decision per revealed session. Before advancing, state whether the hypothesis remains valid and whether the next session would cross an identified event. The exercise rewards a complete decision record, not choosing the path that later looks best.
Measure retracement without treating a percentage as destiny
A pullback can be described relative to a preceding move. If a fictional stock rises from $30 to $36 and retreats to $33, it has retraced $3 of the earlier $6 rise, or 50%. That is a measurement of the observed sequence. It does not establish that $33 is a required turning point or that a rebound has a particular probability.
The selected starting and ending points matter. Choosing a different prior low changes the denominator and therefore the percentage. Record those anchors before using the measurement in a study. A chart that offers several plausible anchors can produce several attractive percentages, so the method needs a stable convention rather than a search for the neatest number.
Use the retracement field as context if the method calls for it, then apply the actual entry and failure rules. A candidate can reach the chosen retracement area without completing its trigger. It can also move through the area and invalidate the idea. The arithmetic does not replace the conditional decision process or the current execution check.
Compare a shallow pause with a deep decline
A shallow pullback can leave the broader sequence intact while offering little entry-to-exit space. A deeper decline can offer a lower purchase price while undermining more of the original structure. Neither is automatically preferable. The question is how the specific method defines eligibility and what each version requires in quantity, cash, and adverse scenarios.
Suppose candidate A offers a $35 entry with a $34 intended exit and a $38 objective. Candidate B offers $33 with a $30 intended exit and the same objective. A has $1 downside distance and $3 target distance; B has $3 downside distance and $5 target distance. The cheaper share price does not by itself produce the more favorable gross distance ratio.
If a hypothetical planned price-loss allowance is $60, the arithmetic quantities are 60 shares for A and 20 for B before costs and cash constraints. Their purchase values differ sharply. Assess the full decision card rather than selecting the candidate with the lower price or the more dramatic rebound story. The structure, execution, and account implications need separate answers.
Avoid redefining a broken trend as a longer pullback
A common review problem is moving the invalidation boundary each time price falls. The first decline is called a pause, the next a deeper pullback, and the next a long-term opportunity. Each description can sound plausible in isolation. Together, they can remove the possibility that the original hypothesis ever fails.
Write the evidence that ends the setup before entry. It may involve a defined structural breach, an expiration, or an event that makes the original information insufficient. If that condition occurs, preserve the failed setup in the record. A later new hypothesis can be researched separately, but it should not inherit the original trade's favorable assumptions automatically.
This separation is particularly important when money is already committed. The desire to recover an entry price can influence which timeframe or indicator is consulted next. A written rule cannot eliminate emotion, but it gives the reviewer a concrete reference. Without it, the journal may record only a series of increasingly accommodating explanations.
Use a two-stage practice review
In the first stage, inspect only the information available before a possible trigger. Label the trend, observation area, event window, and reasons to pass. Do not reveal later bars until those fields are complete. The objective is to determine whether the candidate can be described consistently before its outcome is known.
In the second stage, reveal one session at a time and record changes in eligibility. If a trigger occurs, verify the actual permitted entry opportunity. If no trigger occurs before expiration, close the research card with no trade. If an entry fills, maintain a separate position ledger. These statuses prevent an interesting chart from being counted automatically as a completed profitable idea.
At the end, compare compliant attempts across the whole practice block. Include missed opportunities and failed setups without assigning them hypothetical account returns. Identify one operational question to investigate, such as whether maximum-entry boundaries were applied consistently. The review should improve the precision of the process rather than reward the ability to explain each completed chart after the fact.
## Worked exercise: location, trigger, and fill
Create three dated cards for a fictional stock. Card one records a retreat into the $33–$34 observation area with no trigger. Card two records a qualifying close at $34.20. Card three records the next available ask at $35.10. If the maximum permitted entry is $34.60, the third card produces no eligible entry despite the earlier signal.
Now change the next ask to $34.40 and the intended exit to $32.40. With a $40 price-loss allowance before costs, the arithmetic quantity is 20 shares and purchase value is $688. Model exits at $32.40, $30.40, and $38.40. The price results are minus $40, minus $80, and plus $80 respectively. None of those scenarios supplies its own probability.
Finally, explain which observations would invalidate the setup even before entry. Examples include a prohibited event entering the holding window or a structural failure before the trigger. This prevents the watchlist from retaining a favorable old label after the conditions that justified it have disappeared.
## Frequently asked questions
Does a lower entry always improve a pullback trade? A lower price changes the arithmetic, but it can also arrive with weaker structure or new information. Recheck the hypothesis rather than treating the discount as an independent advantage. If the original failure condition has occurred, the old setup has ended under its rules. A new idea requires a new decision card with current prices and assumptions.
How should an untriggered rebound be recorded? Keep it as an observation without an executed position. Record the trigger that was missing and the expiration. A later rise can be studied as a missed opportunity, but it does not create realized account profit. This distinction preserves the actual opportunity set and prevents a paper record from assuming access to every attractive move.
## Sources and further reading
Swing-trade setup background provides background for the concepts discussed. All numerical cases and worksheets in this lesson are original fictional illustrations, not historical performance results.