

Swing Trading · Lesson 06 of 15 · Reviewed November 10, 2026
A breakout occurs when price moves beyond a defined boundary. For a swing-trading method, the boundary might come from a completed daily consolidation or a prior structural high. The observation can be useful, but crossing a line does not guarantee continuation. An executable plan must address the entry price, the failure condition, the holding window, and the possibility of no fill.
Begin with one definition of a breakout. An intraday trade above resistance and a completed daily close above resistance are different events. A method may study either, but its results cannot freely combine the earlier entries of one with the later confirmation of the other. The timing of information determines which prices were actually available to the decision.
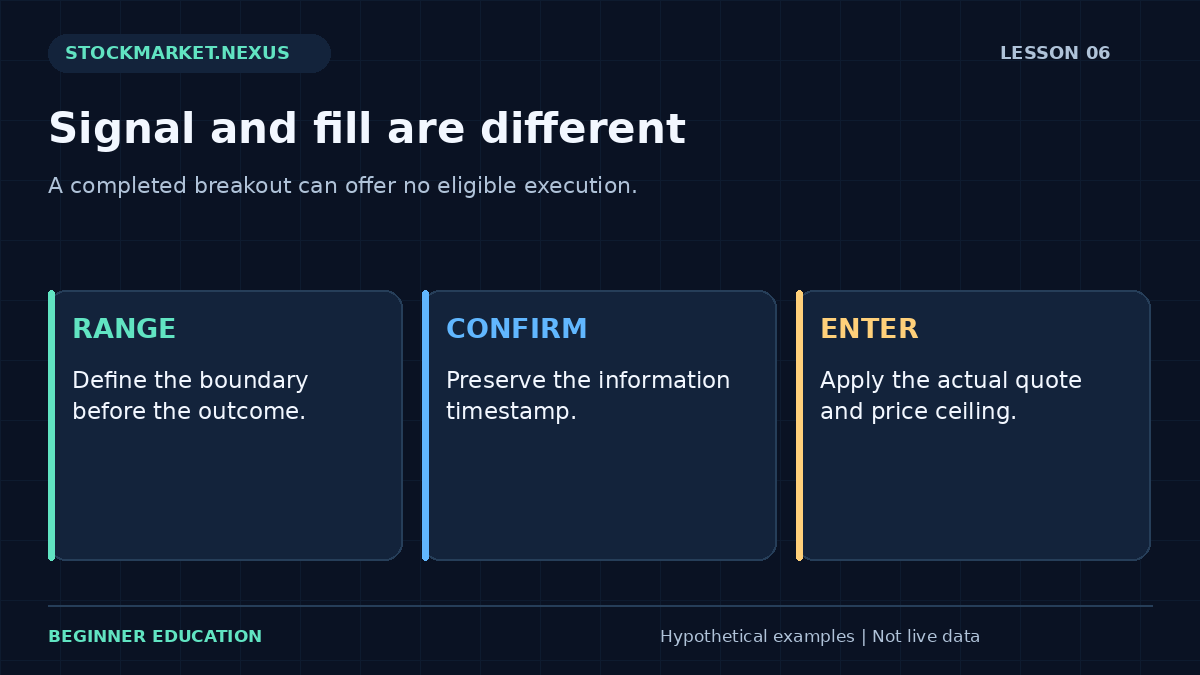
1. Define the range before the outcome
Specify the observation interval and how its boundaries are calculated. A fictional consolidation might span several completed sessions with an upper boundary near $50 and a lower boundary near $47. The reason for selecting those sessions should be written before the next move. Redrawing the range afterward can make a failed setup disappear from the record.
The range does not need to be perfectly horizontal to be worth studying, but the method needs a reproducible rule. If one reviewer calls a chart a consolidation while another calls it a trend, the definition may be too subjective for the intended study. Save examples of borderline and rejected candidates as well as accepted ones.
The support and resistance lesson explains why a historical area is not an impenetrable barrier. A breakout hypothesis begins where the boundary is defined; it does not acquire certainty merely because the line is visually clean.
2. Separate confirmation from execution
Suppose the rule requires a completed close above $50. A $50.20 closing observation can satisfy that condition, but the next available ask may be $50.40, $52, or below the former boundary. The signal record should retain $50.20 while the execution record uses the actual fill. They answer different questions.
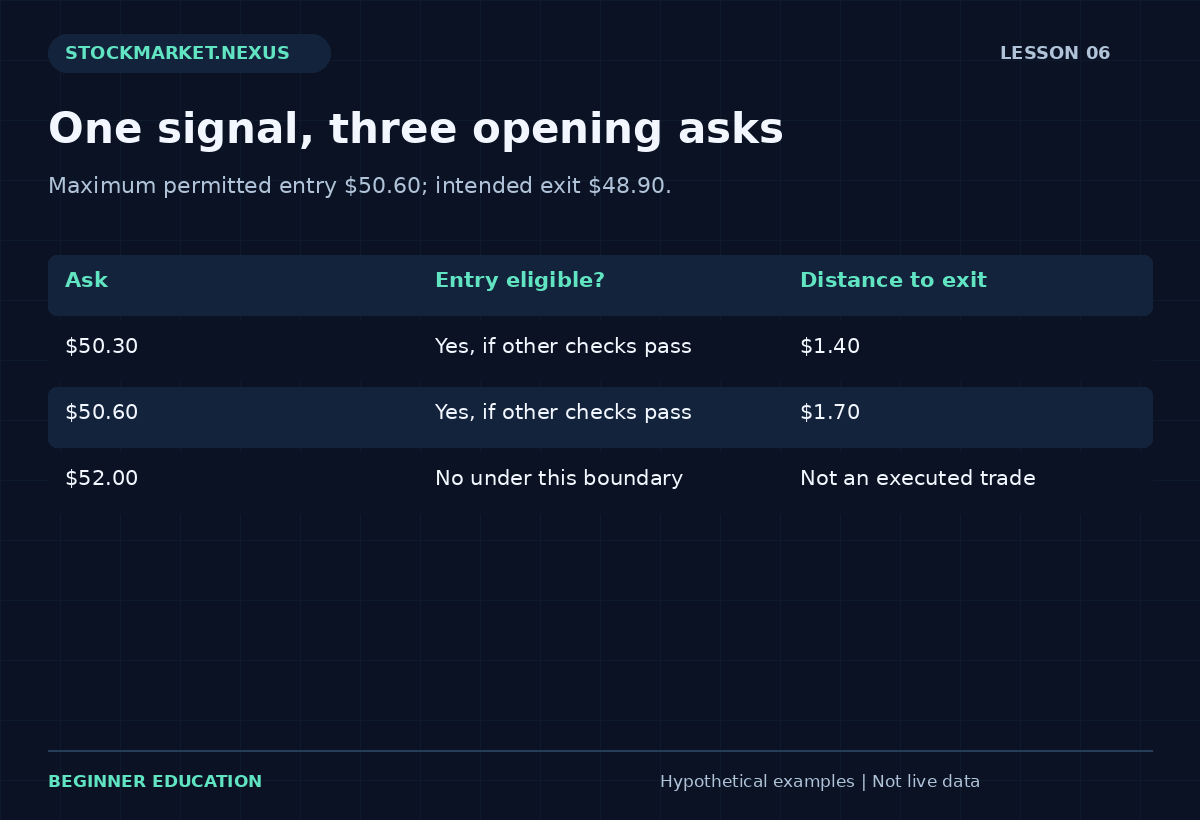
Write a maximum acceptable entry. If the permitted boundary is $50.60, an opening ask at $52 does not fit. A later gain does not retroactively create an eligible $50.20 execution. Recording no entry is necessary to understand how often the method produces a usable opportunity rather than only a chart signal.
The daily chart timing guide describes this information sequence. A realistic study must also specify whether a next-session limit order remains active, how long it lasts, and what cancels the idea. Otherwise, a fill can be assumed at any convenient later point.
3. Recalculate the trade when price changes
Keep a fictional intended exit at $48.90 and an objective at $54. From a $50.40 entry, downside distance is $1.50 and target distance is $3.60. From $52, those distances become $3.10 and $2. The same target and chart boundary no longer describe the same proposed trade.
If the planned price-loss allowance is $60, the first entry supports 40 shares before costs. The second supports 19 whole shares because 19 multiplied by $3.10 is $58.90. Purchase values are $2,016 and $988 respectively. A smaller quantity at the later price does not restore the first entry's distance relationship.
The position-sizing guide combines those calculations with cash and adverse-gap scenarios. Avoid optimizing only the share count while leaving the rest of the decision card unchanged. The current quote can alter eligibility as well as quantity.
4. Define failed-break behavior in advance
A return into the old range can be part of a method's failure definition, but the exact rule matters. Does any intraday trade back inside invalidate the idea, or is a completed close required? Is there an immediate protective instruction? Different answers produce different loss paths and attention requirements.
A planned retest entry is also a separate method. The breakout may never retest, or the retest may occur after the idea has expired. Do not add the retest requirement only to losing examples or remove it only when waiting would miss a winner. A consistent record must preserve the opportunities excluded by each rule.
Include the possibility of a gap through the intended exit. The market can move from one session's close to a lower opening quote without offering an execution at every intervening price. A chart study that assumes a perfect stop fill under that condition is evaluating an idealized mechanism rather than the instruction actually available.
5. Use volume as context without assigning certainty
An increase in completed volume can describe unusually active participation relative to a defined comparison period. It does not prove that the next price move will continue. Record the comparison window, data source, and whether the current session is complete. A partial-day total cannot be compared casually with a full-day average.
Also distinguish activity from liquidity at the intended quantity. A high-volume announcement can still have a wide spread or fast-changing depth. The execution check should use current conditions. The breakout's visual strength and the practicality of entering it are related research questions, not interchangeable facts.
If a study uses a volume threshold, define it numerically before selecting outcomes. Retain candidates below the threshold in an exclusion log rather than forgetting them. This makes it possible to assess whether the filter changes the opportunity set without treating every extra condition as an automatic improvement.
6. Practice the sequence without future bars
Use the Swing Trading Practice Lab to reveal one session at a time. Record whether the current observation is a signal, an eligible execution, an open holding, or a closed result. These statuses prevent a good-looking later chart from overwriting an earlier no-fill decision.
For each attempt, write an expiration and an event rule. A breakout signal that remains unfilled for several sessions may no longer describe the current structure. An earnings release entering the holding window can also change the plan. Rechecking eligibility is different from repeatedly lowering standards until an instruction becomes possible.
The review should preserve both compliant losses and noncompliant profits. A breakout can fail even when every rule was followed. A chased entry can profit while violating the plan. Those observations belong in separate process and outcome fields, allowing the method and the operator's behavior to be studied independently.
Compare a breakout entry with a retest entry
A direct breakout entry and a later retest entry can be studied as separate methods. The direct version may participate before a return to the boundary, while the retest version may offer a different price but miss moves that never return. Neither should be given the other's best outcomes without also inheriting its exclusions and failure paths.
Use one fictional range from $47 to $50. Method A requires a completed close above $50 and an acceptable next-session ask. Method B requires that same initial condition, followed by a defined return toward $50 within three sessions and a separate rebound trigger. Write the exact return area and expiration before revealing the next prices.
If price rises directly to $54, Method B may have no trade. If price returns and then breaks down, Method B may have a losing eligible trade. Retain both sequences. A fair comparison asks what each method could actually execute across the full sample, not which entry looks most elegant on the completed winning chart.
Keep price-distance ratios separate from expectancy
A $50.40 entry, $48.90 intended exit, and $54 objective create a $1.50 downside distance and $3.60 target distance. The gross ratio is 2.4 to one. That figure does not establish the chance of reaching the objective, the size of gap losses, or the net effect of repeated no-fills and costs.
To evaluate expectancy, a study needs a defined sample and actual or consistently modeled outcomes. Some trades may exit by a time rule rather than either price boundary. Others may sell beyond the stop after a gap. A two-outcome diagram can be useful for initial arithmetic but may not represent the full distribution of the method's results.
Report the ratio as geometry under stated prices. Then report observed net outcomes separately with their sample limitations. This avoids turning a favorable-looking chart measurement into an unsupported claim about profitability. A method with attractive target distances can still lose money if failures, execution costs, or adverse discontinuities dominate the realized sequence.
Handle a breakout that occurs during an event window
Suppose a completed breakout appears the evening before a scheduled earnings release. The chart condition and event eligibility are separate checks. If the method excludes that release, the breakout does not override the exclusion. Record the signal and the reason no instruction was permitted. The later market reaction cannot change what the event policy required.
If the method permits event exposure, label the trade accordingly and include it in the appropriate review category. A strong closing bar does not neutralize announcement uncertainty. The next available opening quote can alter the planned entry, trigger an existing exit, or create a no-fill under a limit instruction.
A study should not mix excluded event examples into its winners while leaving similar losing examples out. Preserve the eligibility decision before the event. This makes the comparison between ordinary breakout setups and event-dependent trades more honest, even when the same chart pattern name is used for both.
Review failed breaks with a fixed classification tree
Start by asking whether the original range and trigger met the method's definition. If not, classify the attempt as ineligible under that version. If they did, ask whether an eligible execution was available and actually filled. Only then evaluate the resulting position and its exit. This sequence prevents every unfavorable result from being dismissed as a pattern that never really counted.
For a compliant entry that returns into the range, apply the predefined failure rule and record the actual outcome. If the rule was ignored, retain the account result but label the process deviation. A later recovery does not make the earlier violation disappear, just as a later decline does not prove that every earlier pass was predictive.
At the end of the block, count valid signals, eligible fills, compliant exits, and process deviations separately. These counts reveal whether the main problem is opportunity frequency, execution feasibility, rule behavior, or operation. A single win-rate number cannot identify which part of the breakout process needs further investigation.
## Worked exercise: three opening prices
Use the same completed $50.20 signal, $48.90 intended exit, $54 objective, and $50.60 maximum entry. Compare next-session asks of $50.30, $50.60, and $52. Only the first two satisfy the stated entry boundary. Calculate their downside distances as $1.40 and $1.70, then determine whole-share quantities under a $60 planned allowance before costs.
The quantities are 42 and 35 shares, with planned price losses of $58.80 and $59.50. Compute purchase cash independently and check whether the hypothetical account can fund it. Do not assign a position to the $52 scenario simply to complete the table. Its correct outcome under these rules is no eligible entry.
Finally, model a $46 actual sale for each eligible quantity. The gap losses exceed the planned figures because the available exit differs from the intended trigger. The exercise demonstrates why confirmation, entry, quantity, and execution must remain distinct even when they are all connected to one chart pattern.
## Additional calculation check
Compare a $50.40 entry with an actual $50.55 fill for 40 shares. The fifteen-cent difference adds $6 to purchase value and increases the intended-exit price loss by $6 if quantity and exit remain unchanged. Record the actual fill instead of retaining the submitted limit as though it were an execution. If the revised total no longer fits the planning boundary, the review should identify that discrepancy rather than calling the order successful merely because it filled. This exercise connects a small per-share change with its account-level consequence and makes the difference between a permitted price ceiling and a confirmed purchase explicit.
Frequently asked questions
Must every breakout be traded? No. A valid chart condition can coexist with an unacceptable entry quote, an excluded event, insufficient cash, or excessive portfolio overlap. Record the signal and the separate reason for passing. This makes the evidence more informative than deleting the candidate or forcing an instruction merely because the pattern qualified.
Can a failed breakout become a new setup? It can be researched as a separate hypothesis if a defined method permits it. Preserve the failed original card and create a new dated record. Do not transfer the earlier entry assumptions or erase the loss. Each setup needs its own information time, eligibility check, execution boundary, and account-level review.
## Sources and further reading
Order types and execution provides background for the concepts discussed. All numerical cases and worksheets in this lesson are original fictional illustrations, not historical performance results.