

Swing Trading · Lesson 08 of 15 · Reviewed November 10, 2026
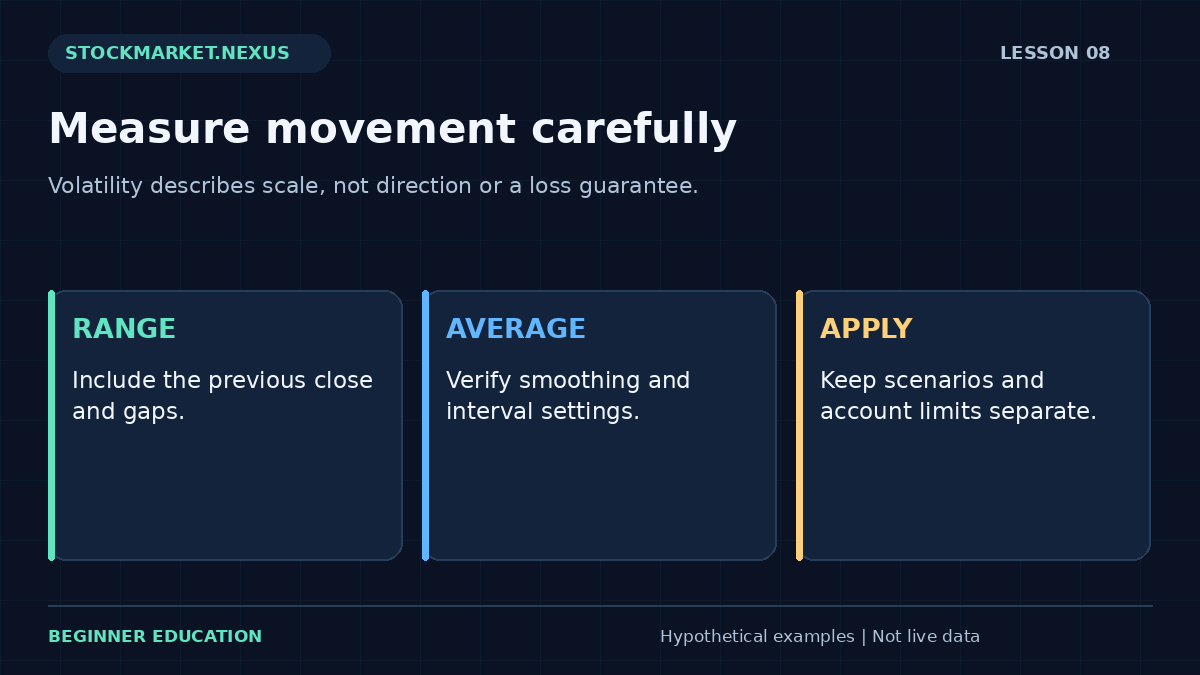
Volatility describes variation in price, not a promise of opportunity. A security that moves widely can create larger favorable and adverse changes, more difficult execution, and greater overnight uncertainty. For a swing-trading plan, a movement measure can help put distances in context, but it cannot determine an appropriate personal loss allowance or guarantee an exit.
Average True Range, commonly called ATR, summarizes a series of true-range observations using a specified averaging method. Different platforms can use different settings. Before comparing values, identify the period, smoothing method, timeframe, and data source. A displayed number is meaningful only within that calculation contract.
1. Calculate true range before averaging it
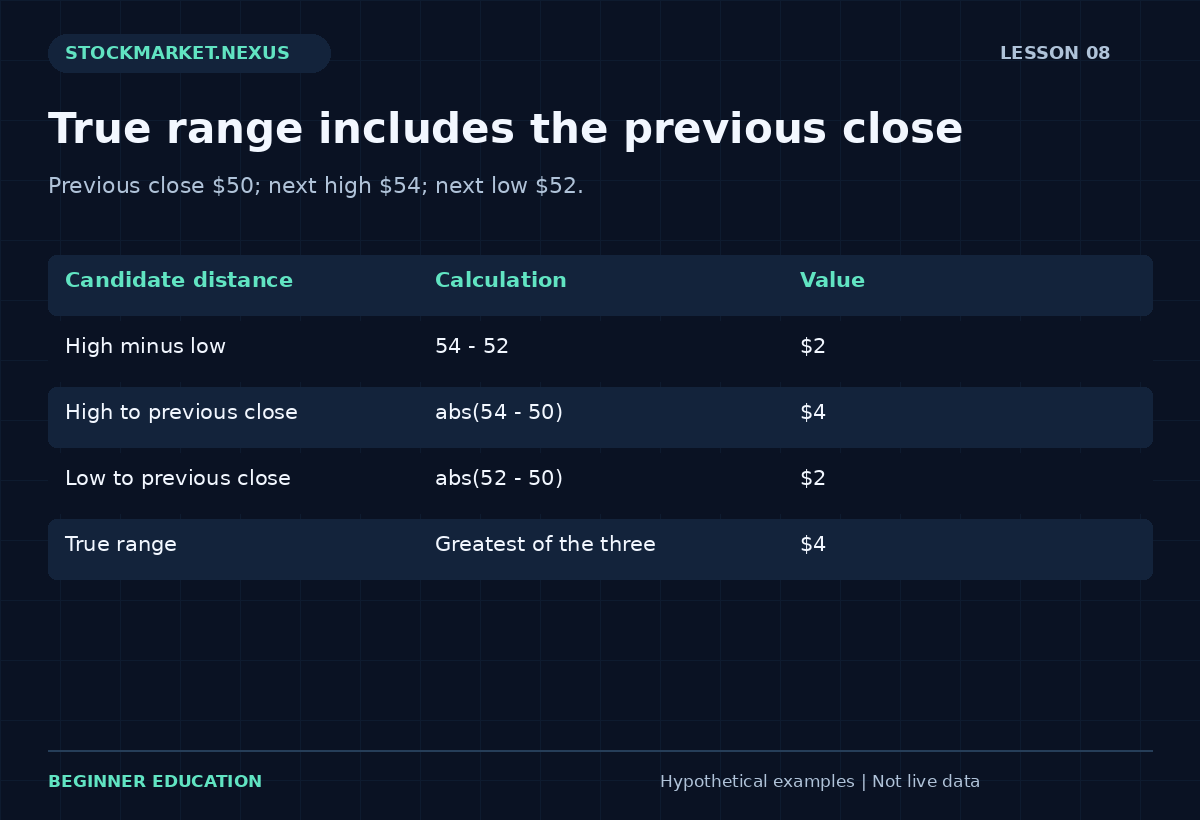
For one bar, true range is the greatest of three distances: high minus low, the absolute difference between high and previous close, and the absolute difference between low and previous close. Including the previous close allows the measure to reflect gaps that a simple high-low range might miss.
Suppose the previous close is $50, the next session's high is $54, and its low is $52. High minus low is $2, high minus previous close is $4, and low minus previous close is $2. True range is $4. The session traded within a $2 range, but the gap from the earlier close contributes to the larger movement measure.
For a transparent learning example, average three fictional true ranges of $2, $3, and $4 using a simple mean. The result is $3. That example is arithmetic practice, not a claim that every chart platform uses a three-period SMA for ATR. Verify the platform's actual implementation before reproducing its values.
2. Distinguish absolute and relative movement
An ATR of $3 has a different scale for a $30 stock than for a $300 stock. Dividing the measure by a reference price can provide a percentage comparison, provided the price and timestamp are stated. At $30, $3 is 10%; at $300, it is 1%. This normalization describes scale, not investment quality.
Do not rank candidates solely by the largest movement percentage. Wider variation can make the required quantity smaller, the quote less practical, or the overnight scenario less affordable. The question is whether the complete method can be operated under those conditions, not whether movement alone is exciting.
The watchlist lesson shows how movement information fits beside identity, liquidity, structure, and event checks. Volatility is one field in a decision process. It is not a substitute for the other fields or a shortcut to an expected-return estimate.
3. Use movement to interpret an exit distance
A planned exit fifty cents from entry can mean different things in a stock whose recent daily movement is twenty cents versus one whose movement is several dollars. A movement measure can reveal that the proposed distance is small or large relative to recent observations. It does not establish where the hypothesis actually fails.
Choose the invalidation logic first, then assess its implications. Moving the exit closer solely to increase quantity can place it inside ordinary fluctuation. Moving it farther away solely to avoid being stopped can enlarge the loss. Neither change is justified by quoting an ATR multiple without explaining the underlying method.
The position sizing and gap-risk guide separates the chosen distance from the account allowance. A volatility measure may help describe the setup; the dollar amount affordable to expose comes from a different decision. Keeping those roles separate prevents circular reasoning.
4. Understand what an ATR multiple does not mean
A distance of two times a recent ATR is not automatically a specified confidence interval. ATR is not a direct probability model for the next adverse move. Without a separately justified distributional model and suitable evidence, the multiplier does not tell the trader how often an exit will be reached or how large the worst gap can be.
Historical average movement also does not cap a future event. A surprise announcement can produce a move larger than the recent sample. If the next available quote lies beyond the protective trigger, the execution can differ from the intended price. A familiar volatility number can make this uncertainty feel smaller without changing it.
The overnight and weekend risk lesson develops those discontinuous scenarios. Use the movement measure as context, then write an adverse-price scenario explicitly. Do not label the scenario a worst case unless its scope and limitations actually justify that description.
5. Keep volatility changes visible during the holding period
A position entered during quiet conditions can encounter a wider range after news. If the method allows a volatility-based adjustment, specify whether the change affects the exit, the quantity, or only the review status. Automatically widening a protective distance while retaining the same shares can increase planned dollar exposure.
For example, 20 shares with a $2 entry-to-exit distance imply $40 of planned price loss. Widening the distance to $4 increases that figure to $80. The indicator's new value does not create additional risk capacity. Any adjustment needs to be evaluated at the account and portfolio level.
Also retain the original reference measure in the journal. If every later value overwrites the entry-time value, it becomes difficult to reconstruct what the original plan assumed. A dated record allows the reviewer to distinguish changing market conditions from a change in the operator's rules.
6. Practice a measurement, not a forecast
Use the Swing Trading Practice Lab to compare planned distances with actual revealed opening quotes. The replay uses fictional data and simplified execution. Its purpose is to make the difference between a planned trigger and an available exit visible, not to estimate the probability of a real stock's next move.
Before each reveal, record the current position and a hypothetical lower opening bid. Calculate the resulting dollar change independently of any ATR value. Then reveal the next session and compare the actual model outcome with the scenario. This keeps risk arithmetic concrete instead of hiding it behind an indicator name.
When reviewing the attempt, note whether the plan remained operational under the adverse opening. A scenario can be financially small yet difficult to manage because of work schedules, unclear instructions, or unavailable information. Volatility analysis should be connected to those practical constraints as well as the chart.
Reproduce the averaging convention before comparing platforms
The true-range observations are only the input to ATR. The averaging method and its initialization affect the resulting series. A platform may use a particular recursive smoothing convention rather than the simple mean used in an introductory arithmetic example. Verify its documentation instead of assuming a mismatch means the data are defective.
When reproducing a value, record the exact period, timeframe, session inclusion, price adjustments, and historical starting point. A daily indicator that includes different session definitions may not match another display. Small discrepancies can matter if a rule uses a precise threshold, so the method should specify how those differences are handled.
For a learning worksheet, use a small labeled simple-average example and avoid claiming it matches every implementation. The purpose is to understand the effect of high-low movement and gaps. Once that is clear, the actual platform convention can be added without confusing the basic measurement with a trading signal or a universal probability estimate.
Compare two securities on a consistent scale
Imagine ALFA at $25 with a movement measure of $1 and BETA at $100 with a measure of $2. ALFA has the smaller dollar value but the larger percentage relative to price: 4% versus 2%. A comparison that uses only absolute dollars can therefore give the opposite impression from a normalized comparison.
Neither comparison determines which candidate fits the account. Suppose ALFA's spread and event uncertainty are also larger. A small share price can still create difficult execution and a large adverse percentage move. BETA's higher purchase price can instead consume more cash for the same number of shares. The decision needs both price-scale and account-scale information.
Record the reference price and timestamp used for normalization. A percentage computed from yesterday's close and one computed from today's rapidly changing quote are not identical observations. Consistency matters more than excessive decimal precision. The worksheet should make the convention obvious enough that another person can reproduce the result.
Stress a changing volatility-based distance
Assume 30 fictional shares entered at $50 with a $48 intended exit. Planned price loss is $60. A later increase in the movement measure leads a proposed rule to widen the intended exit to $46. If quantity stays unchanged, planned price loss doubles to $120. The indicator's change has not created an extra $60 of account capacity.
A method that permits this adjustment must specify how the larger exposure is assessed. It may require reducing quantity, declining the adjustment, or another predefined response. None of those choices should be improvised solely because closing the position would realize a loss. The full account state and actual available prices still govern what can be executed.
Also distinguish planned distance from current unrealized loss. If price is already lower when the adjustment is considered, the decision starts from the actual holding and quote. A revised spreadsheet cannot erase the exposure already incurred. Keep the entry-time plan and the proposed revision together so the review can identify exactly what changed and why.
Avoid turning a movement average into a personal risk budget
A volatility measure describes a security's recent behavior under defined settings. An account loss allowance reflects a separate policy and affordability decision. Multiplying ATR by a chosen number can generate a price distance, but it cannot determine how much money a person can afford to expose. The two inputs come from different questions.
For example, a $3 distance and a $90 planned price-loss allowance imply 30 shares before costs. If the distance becomes $6, the same allowance implies 15 shares. This arithmetic keeps the policy amount constant while changing quantity. It does not establish that either distance is a valid structural exit or that the allowance is appropriate for a particular person.
A professional worksheet labels each input according to its role: observed movement, chosen invalidation, hypothetical allowance, cash availability, and adverse scenario. Keeping those roles visible prevents one indicator value from becoming an all-purpose answer. It also makes the exercise easier to review when the actual holding encounters a gap or a changing event window.
## Worked exercise: range, gap, and quantity
Use a previous close of $80, a next high of $78, and a next low of $75. High minus low is $3, the high-to-previous-close distance is $2, and the low-to-previous-close distance is $5. True range is $5. The opening discontinuity changes the movement measurement even though the bar's own high-low span is smaller.
Now take a hypothetical entry of $80 and an intended exit of $76. With a $60 planned price-loss allowance before charges, the arithmetic quantity is 15 shares. A $72 actual sale creates a $120 price loss. The calculation does not depend on whether a recent ATR was $2, $4, or $5; it depends on actual entry, exit, and quantity.
Finish by explaining what a volatility field adds to the decision card. It can describe recent movement scale and support consistent setup definitions. It cannot replace the event check, cash check, instruction verification, or a clear statement of how much adverse exposure the exercise is intended to model.
## Additional calculation check
Add a worksheet column for the exact observation interval. A movement value calculated from weekly bars cannot be compared directly with a daily value as though both describe the same time span. Recompute on a consistent interval or label the comparison as different measures. This small check prevents a large numerical value from being interpreted as unusually high volatility when it simply summarizes a longer bar. Keep the chosen interval fixed during a practice block so changes in the measure reflect the specified data rather than an unnoticed change in settings.
Frequently asked questions
Does ATR predict whether price rises or falls? The movement measure does not supply a directional forecast. Its inputs describe ranges and gaps under the selected settings. A directional trading hypothesis requires separate definitions and evidence. A large value can accompany favorable or adverse moves, so the worksheet should avoid translating movement scale into a promised opportunity.
Does an ATR-based exit guarantee a bounded loss? No. The chosen multiple creates a planned distance under the method, while actual execution depends on available prices and supported instructions. An event gap can exceed the recent movement sample. Record an adverse-price scenario and the resulting dollars separately, and avoid labeling the multiplier as a probability or maximum-loss guarantee.
## Sources and further reading
ATR calculation and interpretation provides background for the concepts discussed. All numerical cases and worksheets in this lesson are original fictional illustrations, not historical performance results.