

Technical Analysis · Lesson 11 of 15 · Reviewed November 10, 2026
Volume-Weighted Average Price, or VWAP, combines prices and traded quantities into a weighted reference. Large-volume observations contribute more to the result than small-volume observations. The calculation is straightforward, but its interpretation depends on the included transactions, the starting point, the session, and whether the inputs are actual transaction data or bar-based approximations.
This lesson uses fictional price-volume observations so beginners can reproduce the arithmetic exactly. The dedicated exercise calculates cumulative transaction-based VWAP from matching lists. It does not provide live market data, certify execution quality, or treat a price crossing the reference as an automatic trading signal.
1. Calculate the weighted average
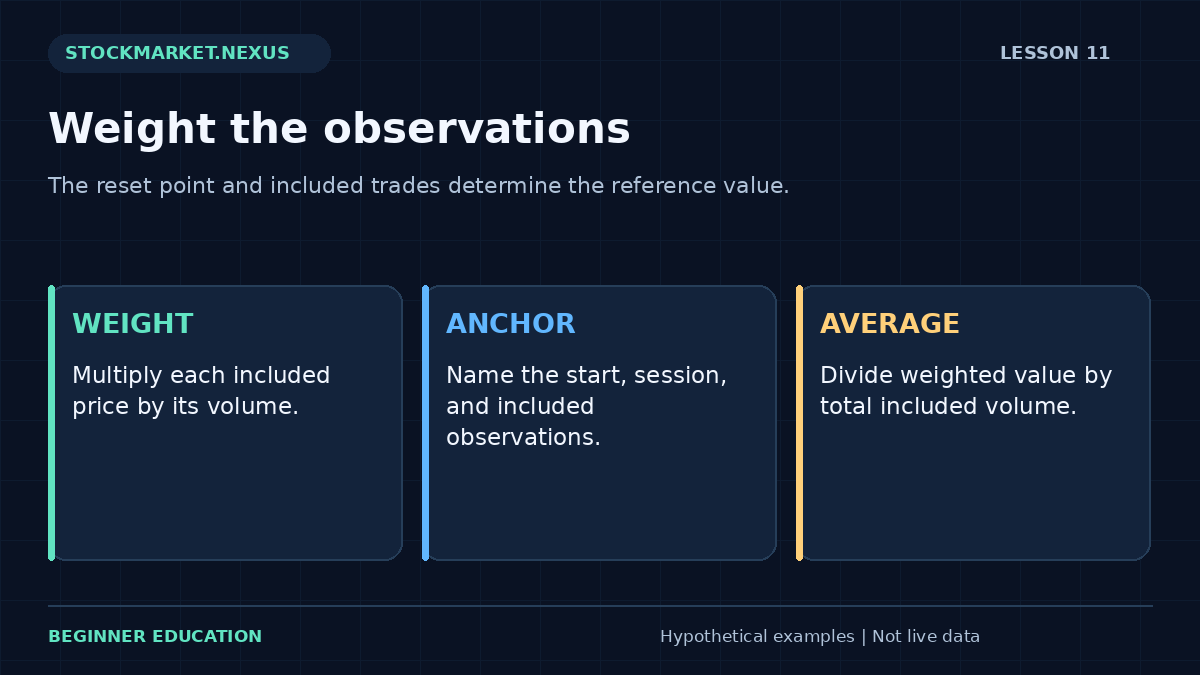
VWAP equals the sum of price times volume across included observations, divided by total included volume. Suppose 100 shares trade at $50, 200 shares at $51, and 100 shares at $49. Dollar-weighted products are $5,000, $10,200, and $4,900, summing to $20,100. Total volume is 400 shares, so VWAP is $50.25.
The simple average of the three prices is $50. That differs because the $51 observation has twice the volume of either other observation. The weighted calculation reflects the quantity distribution in the supplied sample. It does not mean every participant paid $50.25 or that a later order can obtain that price.
If all included volumes are multiplied by the same positive factor, VWAP remains unchanged. The numerator and denominator scale together. If volumes are equal, VWAP equals the arithmetic mean of the supplied prices. These simple checks help verify a spreadsheet or calculator implementation.
2. Define the anchor and reset point
An average needs a starting point. Session VWAP commonly begins at a defined session open and accumulates through that session. Anchored VWAP begins at another explicitly selected time or event. Different anchors include different observations and therefore answer different questions.
The anchor should be chosen for a documented reason before evaluating the subsequent result. Selecting the exact historical low after seeing a large advance can make the resulting line look persuasive while introducing hindsight. If an anchor is revised, preserve the original and record the new selection time.
The worksheet starts at the first supplied observation and ends at the last. It does not infer a market open or event date. The user must supply a chronological, consistently defined sample. A mathematically correct result can still be analytically inappropriate if the lists mix sessions or data sources.

3. Distinguish transaction data from bar approximations
Exact transaction-based VWAP requires the included transaction prices and quantities. Many chart implementations approximate using a representative bar price, such as a high-low-close average, multiplied by that bar’s total volume. That can be useful, but it is not necessarily identical to aggregating every underlying transaction.
A bar’s high, low, and close do not reveal how volume was distributed across its prices. Two bars can have identical OHLC and total volume while placing most transactions at different prices. Their exact transaction VWAPs can differ even if a typical-price approximation matches.
The dedicated exercise deliberately uses price-volume pairs described as fictional transaction observations. It does not label a bar approximation as exact. When comparing a platform’s value, read its source-price and session conventions before assuming the worksheet should match.
4. Read cumulative VWAP as history accumulates
After the first observation at $50 for 100 shares, cumulative VWAP is $50. After adding 200 shares at $51, it becomes $50.6667. Adding 100 shares at $49 produces the final $50.25. The path changes as new weighted observations enter the accumulated sample.
Later observations generally have less influence when the cumulative denominator is already large, unless their own volume is substantial. This is a property of the accumulated weights, not evidence that the market has become less responsive. A new high-volume interval can still move the average materially.
A session reset discards the previous session’s accumulated denominator for the new session’s calculation. A multi-session anchored average does not reset in the same way. Comparing the two without naming their horizons can create a false impression that one platform’s line is inaccurate.
5. Separate location from execution quality
A reference price above VWAP means it exceeds the selected weighted historical average. It does not prove the instrument is expensive in a fundamental sense or that price will reverse. A price below VWAP likewise does not establish a bargain or a favorable purchase.
Execution benchmarking requires a defined objective, time window, side, order size, and market context. A purchase below one selected VWAP may look favorable under that benchmark while still being unsuitable for another objective. A single reference does not capture market impact, opportunity cost, missed fills, or the full decision process.
The stock quote lesson helps distinguish a historical transaction average from a currently available bid or ask. The worksheet calculates a reference value; it does not simulate executable liquidity.
6. Understand crossings and trend context
Price can cross VWAP repeatedly in a range. A method that trades every crossing can incur repeated costs without capturing a sustained move. In a directional session, price can remain on one side for a long time. Neither observation makes the line a universal support or resistance barrier.
A testable VWAP rule should state whether it uses a completed bar, a live transaction, a buffer, a retest, or a time restriction. These choices affect the sample and execution timing. A vague instruction such as “buy when it reclaims VWAP” omits enough detail to describe many different strategies.
For an intraday application with additional context, see VWAP for day trading. This foundation lesson focuses on the weighted arithmetic and data definitions that must be understood before any application is evaluated.
7. Use the dedicated weighted-price exercise
Open the Lesson 11 VWAP exercise. Enter prices 50, 51, 49 and volumes 100, 200, 100. The result should show total volume 400, weighted value 20,100, and VWAP 50.25. A cumulative line illustrates how each successive pair changes the running reference.
Change all three volumes to 100. The result becomes the simple price average of 50. Next restore the original list and increase only the $49 observation’s volume to 1,000. The final average moves toward $49 because that observation now carries more weight. Explain the direction of the change before calculating.
The lists must contain the same number of observations. Negative volumes are rejected, and total volume must be positive. A zero-volume observation contributes nothing to the numerator or denominator. Before any positive cumulative volume exists, the running average is undefined and the chart should not invent a value.
8. Inspect what volume weighting leaves out
VWAP summarizes prices and quantities, not the sequence of every available quote or the intentions behind trades. A high-volume observation at a higher price raises the average, but the formula does not identify whether participants were opening, closing, hedging, or responding to news.
The same final VWAP can arise from different paths. A steady session and a volatile session can share a weighted average. Review the underlying price path, range, and timing rather than using the final number as a complete description of market conditions.
Volume quality matters as much as price quality. A source with incomplete coverage can produce a valid weighted average of its included sample while differing from a consolidated benchmark. The volume and RVOL lesson explains why units, coverage, and comparable intervals must remain visible.
9. Design a reproducible VWAP study
Record the anchor, session, included data, transaction or bar convention, completion rule, trigger, hypothetical execution time, and exit horizon. If a rule uses an anchored line, explain when the anchor could have been selected without future information. This is especially important for anchors placed at historical turning points.
Keep all eligible crossings or retests, including repeated failures. Decide how overlapping events are handled before reviewing results. Counting every successful retest while ignoring earlier failed ones creates an incomplete sample and overstates the apparent usefulness of the reference.
Compare net outcomes with a suitable baseline and include costs. A historical line can make timing appear easy while actual fills depend on spread, latency, available quantity, and order instructions. The study should acknowledge where the data cannot support a precise execution claim.
10. Confirm the core distinction
You should be able to calculate weighted products, total volume, cumulative VWAP, and the effect of changing one observation’s weight. You should also explain the difference between transaction-based calculation, bar approximation, session reset, and an explicitly chosen anchor.
VWAP is useful because it provides a clearly defined weighted reference. Its professional use depends on naming the included information and avoiding claims the calculation cannot support. Understanding the denominator and anchor makes the line easier to interpret and prevents a historical average from being mistaken for a forecast or guaranteed transaction price.
Case review: order changes the path, not the final weighted sum
Prices 50, 51, 49 with volumes 100, 200, 100 produce final VWAP 50.25. Reordering the paired observations to 49, 50, 51 with volumes 100, 100, 200 preserves the final numerator and denominator, so the final VWAP remains 50.25. The cumulative path differs because the observations arrive in a different order.
This is a useful distinction between an endpoint summary and a chronological display. A final average cannot reconstruct the route by which the market reached it. If a rule depends on crossings during the interval, the order of observations matters even when the endpoint average is identical.
For practice, calculate cumulative VWAP after each pair in both lists. Keep each price attached to its own volume when reordering. Separating the lists independently would create different observations and a different weighted sample. This simple bookkeeping check prevents a common spreadsheet error and reinforces why matching lengths alone is insufficient: the pairs and their timestamps must also correspond correctly.
A repeatable practice and review protocol
Before changing the example, write down the question you expect the calculation to answer. Copy the input values, units, chronological order where relevant, and the observation time. State whether the values are fictional, historical, or current. The exercises in this course begin with fictional data so the arithmetic can be studied without implying that a real security offers a particular opportunity. A calculator result is only as meaningful as its input definitions.
Predict the direction of one change before pressing the calculation button. Change one input at a time, explain which part of the formula it affects, and compare the result with your prediction. This controlled approach is more informative than changing several fields until an attractive number appears. If the result surprises you, return to the definition and denominator before looking for a market explanation. Arithmetic mistakes and interpretation mistakes require different corrections.
Then test an ordinary alternative and an edge case. An ordinary alternative checks whether you understand the relationship away from the default example. An edge case checks whether a ratio becomes undefined, a sample becomes insufficient, or an input ordering becomes impossible. A clear validation message is a useful result. Do not work around it by entering an unrelated value merely to make the screen produce an answer. First understand which assumption the rejected value violated.
Save a short review with four parts: the observation, the calculation, the interpretation, and the unresolved limitation. Keep those parts separate. The observation records what the supplied data says; the calculation shows how the number was obtained; the interpretation is a conditional hypothesis; the limitation identifies information the exercise does not provide. This structure makes the note understandable to another beginner and makes later revisions easier to audit.
If you extend the example into a paper-trading study, define signal time, decision time, order assumptions, quantity, costs, and review horizon before checking the outcome. Preserve the original version. Record unfavorable cases and skipped cases under the same rules as favorable ones. A chart image can support the record, but it should not replace the actual values and definitions. A successful-looking historical picture is not a substitute for a complete sample.
Finish by explaining the result in plain language without using a pattern name as the explanation. Identify what changed, what stayed fixed, and what the exercise still cannot establish. You have completed the practice when you can reproduce the important arithmetic, recognize an invalid comparison, and describe an alternative outcome. Repeating this process across the course builds a consistent analytical habit while keeping the different formulas and their limitations distinct.
Sources and calculation notes
Primary educational background provides additional context for the topic. The fictional examples, teaching cases, diagrams, and worksheets here are original educational illustrations. Calculation conventions and missing information are stated explicitly; indicator readings do not establish future returns.