


Technical Analysis · Lesson 02 of 15 · Reviewed November 10, 2026
A candlestick represents four prices for a defined interval: open, high, low, and close. Its body and wicks make those values easy to compare, but the shape does not reveal the full sequence of trades inside the interval. Reading a candle professionally begins with its construction and ends with the questions its compressed information cannot answer.
Beginners often learn dramatic names before learning the underlying measurements. A long lower wick can be described precisely without declaring that a reversal is inevitable. This lesson shows how to reconstruct a candle, measure its proportions, identify incomplete information, and compare the same shape across different settings. The examples use fictional prices and do not identify trading opportunities.
1. Establish the interval and session
The open is the first included price and the close is the last included price for the selected bar. The high and low are the extremes of the included observations. The word “included” matters: a five-minute bar, a regular-session daily bar, and an extended-hours daily bar can contain different trades and therefore different values.
A candle that is still forming can change repeatedly. Its current close moves with new observations, its high can increase, and its low can decrease. An apparent long-wick rejection may become a large body before the interval ends. A study using completed candles should wait for the specified interval to finish and record the timestamp at which the completed values became available.
Platform time zones and session boundaries affect aggregation. A visitor comparing charts from two sources should verify those settings before deciding one chart is wrong. Specialized chart types, including transformed candles, may use calculated opens and closes rather than raw interval OHLC. This lesson and its exercise use ordinary OHLC candles.
2. Read the body and the two wicks
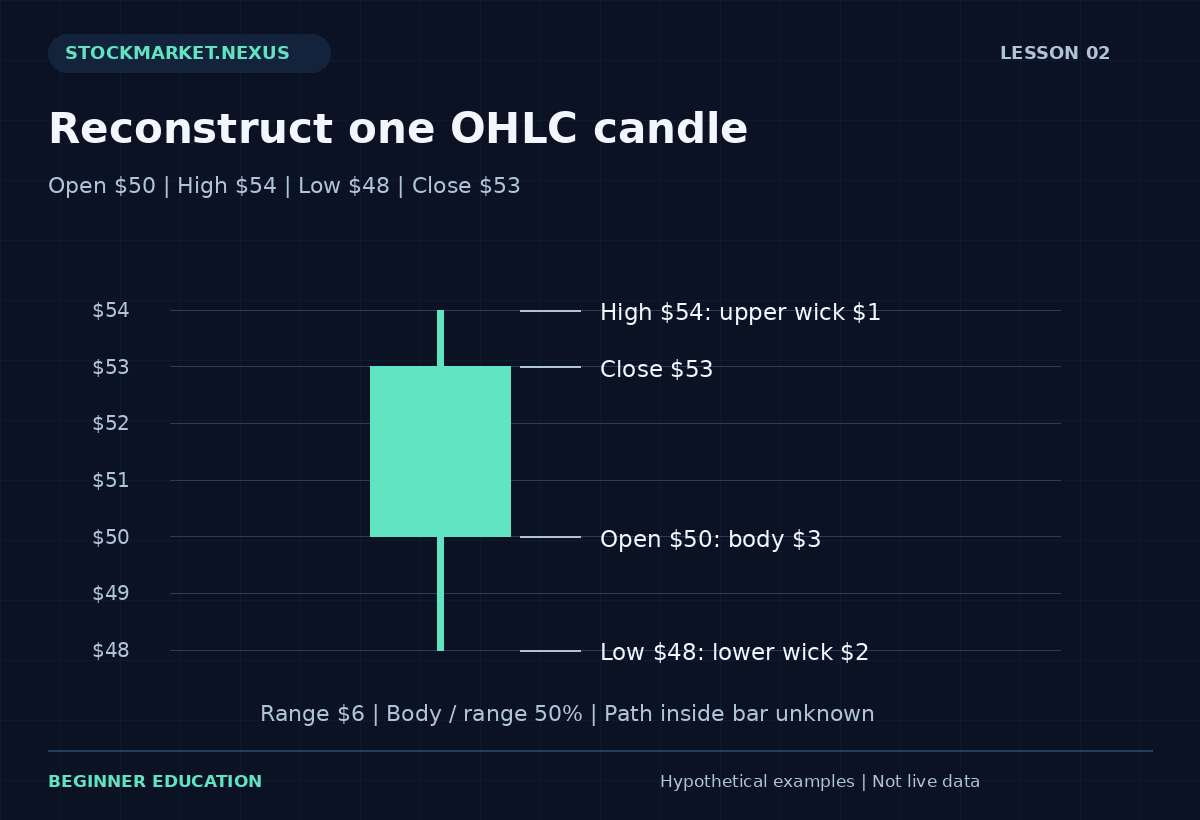
The body spans the open and close. Its height is the absolute value of close minus open. The upper wick runs from the higher of open and close to the high. The lower wick runs from the low to the lower of open and close. The full range is high minus low. These definitions work for both rising and falling candles.
Consider open $50, high $54, low $48, close $53. The body is $3, upper wick $1, lower wick $2, and full range $6. The body occupies 50% of the range. Changing the close to $49 makes the body $1, upper wick $4, and lower wick $1 while preserving the same $6 range. A single field can substantially change the visual impression.
Color conventions vary. Some platforms use green and red, others white and black, and some distinguish whether the close exceeded the previous close as well as the current open. Read the legend. “Green” is not a universal numerical definition. The exercise labels the relationship between open and close in words and displays the actual prices.
3. Check whether the candle is mathematically possible
An ordinary candle requires high to be at least as large as both open and close, and low to be no greater than either. High must also be at least low. An input such as open $50, close $53, high $52, low $48 is inconsistent because the close exceeds the reported high. A professional tool should reject it rather than draw a convincing but impossible graphic.
If all four values are equal, the range is zero. Body and wick sizes are zero, but body divided by range is undefined. The worksheet reports that ratio as not defined rather than producing a misleading percentage. A zero-range observation may represent a genuinely unchanged included price or sparse data; the candle alone does not distinguish those explanations.
Large outlier wicks deserve a source check. An erroneous print, adjustment inconsistency, or an illiquid interval can create a shape that looks significant. Compare the underlying values, trading session, and source quality before adding a psychological interpretation. A beautiful annotation cannot repair an unreliable observation.
4. Understand what OHLC cannot reveal
Open $50, high $54, low $48, close $53 could arise through several paths. Price might rise to $54, fall to $48, then recover. It might fall first, advance later, and close just below the high. Both paths produce the same candle, yet an intrabar order or protective level could behave differently under each sequence.
This ambiguity matters in backtests. If a bar contains both a hypothetical target and stop threshold, OHLC alone may not establish which was reached first. Assuming the favorable sequence can inflate a simulated result. Use finer data when appropriate, define conservative ambiguity handling, or mark the observation unresolved. Do not claim precision that the available data cannot support.
A candle also does not disclose every participant’s motive, outstanding orders, or the price available for a later fill. The last price can differ from bid and ask. An observed wick is a historical range, not a promise that an order submitted afterward could trade at its extreme. Review bid-ask spreads and slippage before translating any chart price into a transaction assumption.
5. Interpret a shape within its surrounding structure
A small body after a strong advance describes a narrow open-close change within that interval. It does not establish that all buyers have become uncertain. The same body after a decline, inside a range, or around an earnings release can have different relevance to a predefined study. Context should be specified in observable terms rather than added as a story after the outcome.
Measure the candle relative to neighboring bars. A $2 body is large compared with a recent $0.30 average body and small compared with a recent $5 average body. A long lower wick can be prominent in absolute dollars but ordinary for a highly volatile security. Use consistent comparison windows and avoid switching windows simply to make the shape look exceptional.
Location is another separate variable. A wick near a previously identified reference area raises a question about a historical reaction there. It does not prove that the area will hold next time. The support and resistance lesson explains how to define such zones before reviewing their subsequent reactions.
6. Use pattern names as shorthand, not verdicts
Terms such as doji, hammer, and engulfing describe families of visual arrangements. Different educators and platforms may use different body thresholds, wick ratios, or context rules. If a pattern is part of a test, write the numerical definition. “A small body” is not reproducible until small has a stated relationship to range or a comparison sample.
For example, a research definition might require a body no greater than 20% of the full range and a lower wick at least twice the body. That is a chosen filter, not a universal law. It may classify several market situations together, and a small body can make wick-to-body ratios unstable. A zero body needs explicit handling.
A pattern label does not supply an entry price, an execution method, a holding period, or an acceptable loss. Those must be separately defined. If a learner cannot explain the OHLC measurements behind the name, memorizing more names is unlikely to improve the quality of the analysis.
7. Follow the dedicated candle exercise
Open the Lesson 2 candle exercise. Enter open $50, high $54, low $48, and close $53. Before calculating, sketch where the body should sit. The tool should show a rising body from $50 to $53, an upper wick to $54, and a lower wick to $48. Compare each numerical measurement with the drawing.
Next set the close to $49. The tool will preserve the high and low but show a falling body. Explain why the upper wick becomes longer even though the high is unchanged. The change comes from the body’s new upper boundary, which is now the open at $50. This is a useful check that you understand the geometry rather than simply recognizing a color.
Test an invalid high of $49 while the open remains $50. The calculator should show an understandable error and withhold the measurements. Finally set all four fields to $50. The result should make the zero-range exception clear. These edge cases are part of reading data responsibly, not optional technical trivia.
8. Compare two intervals without inventing extra evidence
Two consecutive small candles can combine into a larger candle on a longer timeframe. Conversely, a smooth daily candle can contain many intraday reversals. The choice of interval changes the summary, so a conclusion drawn from one timeframe should not be silently attributed to every timeframe.
Suppose a completed daily candle closes above its open, while the final hourly candle closes below its own open. There is no contradiction. The daily interval can contain a net advance and a late pullback simultaneously. Define which question each interval serves. The course’s trend structure lesson develops a consistent method for describing broader structure without treating every small fluctuation as a reversal.
Avoid scanning intervals until one produces the preferred shape. That habit increases the number of unrecorded alternatives considered and makes later confidence difficult to justify. If multiple intervals are part of the routine, name them in advance and preserve conflicting observations rather than hiding them.
9. Create a useful candle journal entry
Record the OHLC values, session, interval end time, full range, body, and wick lengths. Add whether the bar is completed and whether prices are adjusted. These fields make the analysis reproducible even if the saved image becomes unavailable. A screenshot can then add visual context rather than serving as the only evidence.
Write a neutral observation before a hypothesis. “Lower wick $2, body $3, close $1 below high” is neutral. “Possible recovery within the interval” is a narrower hypothesis than “institutions are buying.” Neither observation reveals who traded. Keep participant stories out of the record unless supported by additional reliable information.
When reviewing the example later, compare the original question with the actual subsequent path. A following advance does not prove that the candle shape caused it. A following decline does not make the OHLC measurement wrong. Measurement quality and predictive usefulness are different issues and deserve separate review.
10. Check understanding before moving on
You should be able to reconstruct a candle from four numbers, identify impossible values, handle a zero range, and explain at least two possible intrabar paths. You should also be able to explain why the current candle can change and why a historical high is not necessarily an available fill.
The most useful next step is a small collection of completed examples measured using the same rules. Include ordinary candles as well as striking ones. Learning what is common helps prevent treating every visible shape as exceptional. Accuracy in these basic measurements supports every later lesson involving trends, ranges, breakouts, and volatility.
Case review: identical candles, different paths
Consider two intervals with open $50, high $54, low $48, and close $53. In the first, price visits the high before the low; in the second, it visits the low before the high. Both produce the same ordinary candle. A hypothetical plan with a target near the high and a protective reference near the low cannot determine its outcome from the final candle alone.
This is why a chart-reading lesson should not quietly become a precise execution simulation. The candle’s body and wicks are fully measurable, while the sequence remains unresolved. Finer observations may help, but they bring their own timestamp and coverage requirements.
For your review, write both possible paths beneath the same drawing. Identify which conclusions survive either sequence: the range, body, wick lengths, and closing location remain the same. Identify which conclusion does not survive: the order in which a target and protective reference were visited. This exercise makes the difference between accurate summary and missing chronology tangible. It also explains why a visually striking shape can support a question without supplying a complete trade result.
A repeatable practice and review protocol
Before changing the example, write down the question you expect the calculation to answer. Copy the input values, units, chronological order where relevant, and the observation time. State whether the values are fictional, historical, or current. The exercises in this course begin with fictional data so the arithmetic can be studied without implying that a real security offers a particular opportunity. A calculator result is only as meaningful as its input definitions.
Predict the direction of one change before pressing the calculation button. Change one input at a time, explain which part of the formula it affects, and compare the result with your prediction. This controlled approach is more informative than changing several fields until an attractive number appears. If the result surprises you, return to the definition and denominator before looking for a market explanation. Arithmetic mistakes and interpretation mistakes require different corrections.
Then test an ordinary alternative and an edge case. An ordinary alternative checks whether you understand the relationship away from the default example. An edge case checks whether a ratio becomes undefined, a sample becomes insufficient, or an input ordering becomes impossible. A clear validation message is a useful result. Do not work around it by entering an unrelated value merely to make the screen produce an answer. First understand which assumption the rejected value violated.
Save a short review with four parts: the observation, the calculation, the interpretation, and the unresolved limitation. Keep those parts separate. The observation records what the supplied data says; the calculation shows how the number was obtained; the interpretation is a conditional hypothesis; the limitation identifies information the exercise does not provide. This structure makes the note understandable to another beginner and makes later revisions easier to audit.
If you extend the example into a paper-trading study, define signal time, decision time, order assumptions, quantity, costs, and review horizon before checking the outcome. Preserve the original version. Record unfavorable cases and skipped cases under the same rules as favorable ones. A chart image can support the record, but it should not replace the actual values and definitions. A successful-looking historical picture is not a substitute for a complete sample.
Finish by explaining the result in plain language without using a pattern name as the explanation. Identify what changed, what stayed fixed, and what the exercise still cannot establish. You have completed the practice when you can reproduce the important arithmetic, recognize an invalid comparison, and describe an alternative outcome. Repeating this process across the course builds a consistent analytical habit while keeping the different formulas and their limitations distinct.
Sources and calculation notes
Primary educational background provides additional context for the topic. The fictional examples, teaching cases, diagrams, and worksheets here are original educational illustrations. Calculation conventions and missing information are stated explicitly; indicator readings do not establish future returns.