

Technical Analysis · Lesson 01 of 15 · Reviewed November 10, 2026
A price chart compresses many decisions into a small visual space. That compression is useful, but it can also make an uncertain situation look more orderly than it really was. Technical analysis is the study of market information such as prices, ranges, and trading volume. A disciplined beginner uses it to describe what has happened, formulate a question about what might happen next, and define how that question could be tested.
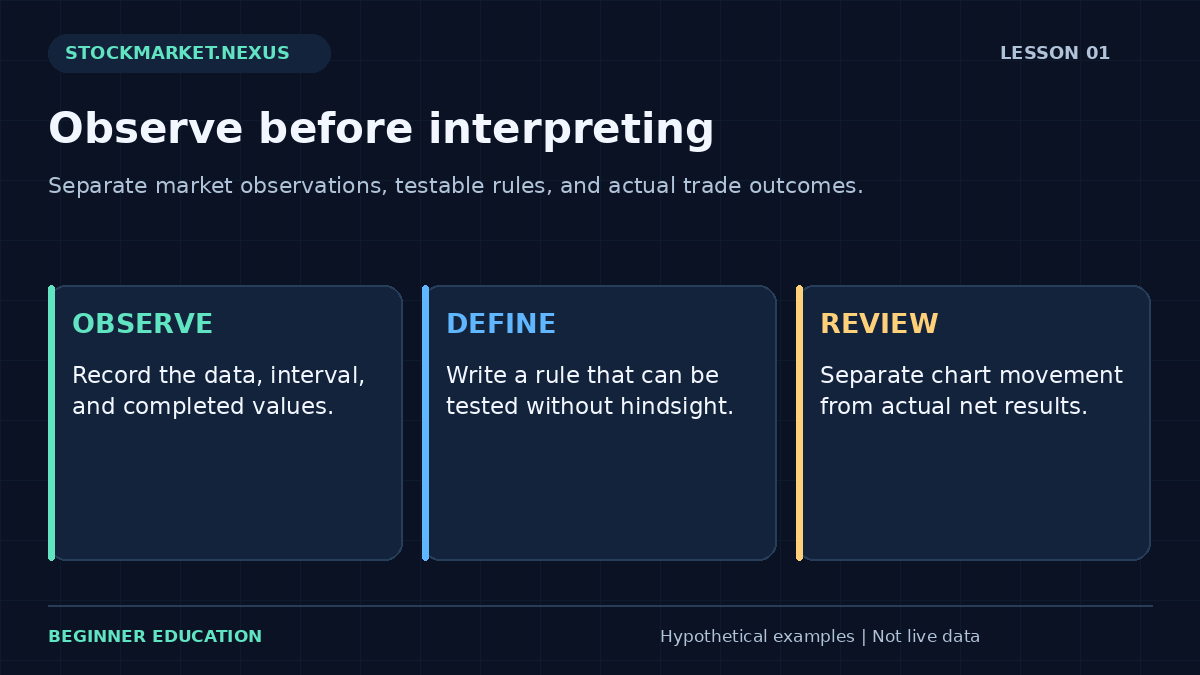
The essential skill is separating observation from interpretation. “The last close exceeded the previous ten completed closes” is an observation with an explicit definition. “Buyers are in control and the stock must rise tomorrow” adds a causal explanation and a forecast that the observation alone cannot establish. This lesson develops a practical routine for keeping those layers separate, using fictional share prices rather than recommendations about any security.
1. Start with the decision, not an indicator
Before opening a chart, name the decision you are studying. A long-term investor comparing businesses, a student measuring daily volatility, and a trader planning an intraday exit have different questions. Their charts may use the same prices, yet require different context. Choosing an indicator before choosing a question encourages a search for attractive signals rather than a coherent analysis.
Write a short research statement: “I want to examine whether a close above a previously defined range was followed by higher prices over the next five completed sessions.” This is more useful than “I am looking for strong charts.” It identifies a trigger, a horizon, and a measurable outcome. It still needs rules about the range, execution, costs, and the comparison group, but those missing details are now visible.
A chart routine should also identify what it does not evaluate. Price and volume do not explain a company’s financial statements, guarantee liquidity, reveal all order intentions, or remove event risk. A clean pattern can coexist with a pending earnings announcement or a trading halt. Technical observations belong alongside instrument knowledge and practical account constraints.
2. Verify the data before interpreting its shape
Record the security identifier, venue or data source, time zone, bar interval, and session definition. A daily candle built from regular trading hours can differ from one including extended hours. A weekly candle is incomplete before the selected week ends. If two analysts compare different session boundaries, apparently conflicting conclusions may be a data-definition problem.
Check whether prices are adjusted for stock splits, distributions, or other corporate actions. A split can create a large mechanical discontinuity in unadjusted historical prices. Adjusted series can make continuity easier to study, but an adjusted historical price is not necessarily the cash price at which an old order could have filled. Historical execution research must maintain a consistent treatment of quantities, prices, and cash events.
Missing observations, stale quotes, corrected trades, and thinly traded instruments can distort familiar indicators. A smooth line is not evidence that the source is complete. Before analyzing any individual print, review how to read a stock quote so the difference between a last trade and a currently executable quote remains clear.
3. Describe price with a small set of observable facts
Begin with the current or most recent completed bar, then move outward. Note the close, the high-low range, whether an opening gap occurred, and the relationship to a previously identified reference area. Describe several completed bars before assigning a pattern name. This gives another person enough information to understand the observation without relying on your visual impression.
Use both absolute and percentage measures where helpful. A move from $50 to $51 is $1 and 2%. A move from $100 to $101 is also $1 but only 1%. Neither comparison measures risk by itself, yet the percentage view prevents a common scale mistake. For long historical charts, a logarithmic axis can make equal percentage changes visually comparable; a linear axis makes equal dollar changes comparable.
Avoid counting several derivatives of the same closing prices as independent evidence. A rising moving average, positive MACD, and a momentum reading may all reflect overlapping information from the same recent advance. Combining them can be a research choice, but “three indicators agree” is not automatically equivalent to three independent tests.
4. Turn an impression into a reproducible rule
Suppose a fictional stock has traded between $48 and $50 over a defined set of ten completed daily sessions. One possible study labels a breakout only when the next completed daily close exceeds $50. A different study labels the first intraday trade above $50. These are different rules, with different information times and potentially very different outcomes.
Specify which observations determine the boundary. If the range includes today’s evolving high, the boundary moves while you watch it. If it uses only prior completed bars, the boundary is fixed for today’s test. Neither design should be hidden inside a vague phrase such as “a clear break.” A reader must be able to apply the rule without seeing the future.
Also define failure before reviewing the result. Failure might mean a close back inside the range, an adverse price threshold, or simply no progress within the study horizon. Those definitions answer different questions. A time-based failure can occur even if price never touches a protective level. The research notebook should preserve the original rule rather than replacing it after a disappointing outcome.
5. Price movement and account profit are separate calculations
Imagine a chart rises from $50 to $52. The chart’s reference-price change is 4%. Now assume a hypothetical purchase of 20 shares actually fills at $50.10, a later sale fills at $51.90, and total charges are $2. Gross trading profit is 20 × $1.80, or $36. Net profit is $34. Entry cash including a separately allocated portion of fees would require its own stated convention.
The 4% chart movement did not become a 4% account return. The trader entered and exited at different prices, used only part of the account, and paid costs. A position return, a reference-price return, and an account return have different denominators. Report the denominator explicitly rather than labeling every percentage “ROI.”
The dedicated worksheet uses a simpler convention: net result equals shares times actual exit minus actual entry, less the entered total charges. Net return is divided by entry share value, excluding fees from that denominator. It is a transparent educational convention, not a brokerage performance report. Learn why fills can differ from chart prices in the lesson on bid-ask spreads and slippage.
6. Build a three-pass chart review
The first pass establishes context. Identify the instrument, selected timeframe, session, adjustment setting, upcoming known events, and the wider price structure. Save this information before drawing conclusions. The purpose is to understand which question the chart can answer and which information remains outside the chart.
The second pass records a small number of relevant observations. For a trend study, that might be confirmed pivots and a specified moving average. For a volatility study, it might be range and an ATR calculation. Choose observations because they serve the research question. Adding more overlays after a trade fails can quietly turn analysis into an explanation assembled after the fact.
The third pass writes alternative scenarios. Price might continue beyond the reference area, return inside it, or remain indecisive. Explain what new information would distinguish those cases and when it becomes available. A scenario is useful when it changes a planned observation or action; a list of every imaginable market outcome is merely noise.
7. Preserve a decision record that can be audited
Capture the chart with its timestamp, settings, and annotations. Record the exact reference values, not only a screenshot. Images help reconstruct context, but calculations require numbers. A later price adjustment or platform-setting change can make an old chart look different, so the underlying rule and data snapshot are important parts of the record.
Separate fields for “observed,” “inferred,” and “unknown.” Observed might contain “close $50.40 above prior range high $50.” Inferred might contain “possible continuation.” Unknown might contain “next opening liquidity and overnight news.” This simple separation discourages false certainty and makes review more honest.
After the study horizon, record the actual path and the outcome under the original rule. Include failed examples, skipped cases, and data problems. A notebook containing only attractive charts cannot show the frequency of success. If a rule was changed during the study, save the earlier version and treat the revision as a new experiment.
8. Practice with a controlled example
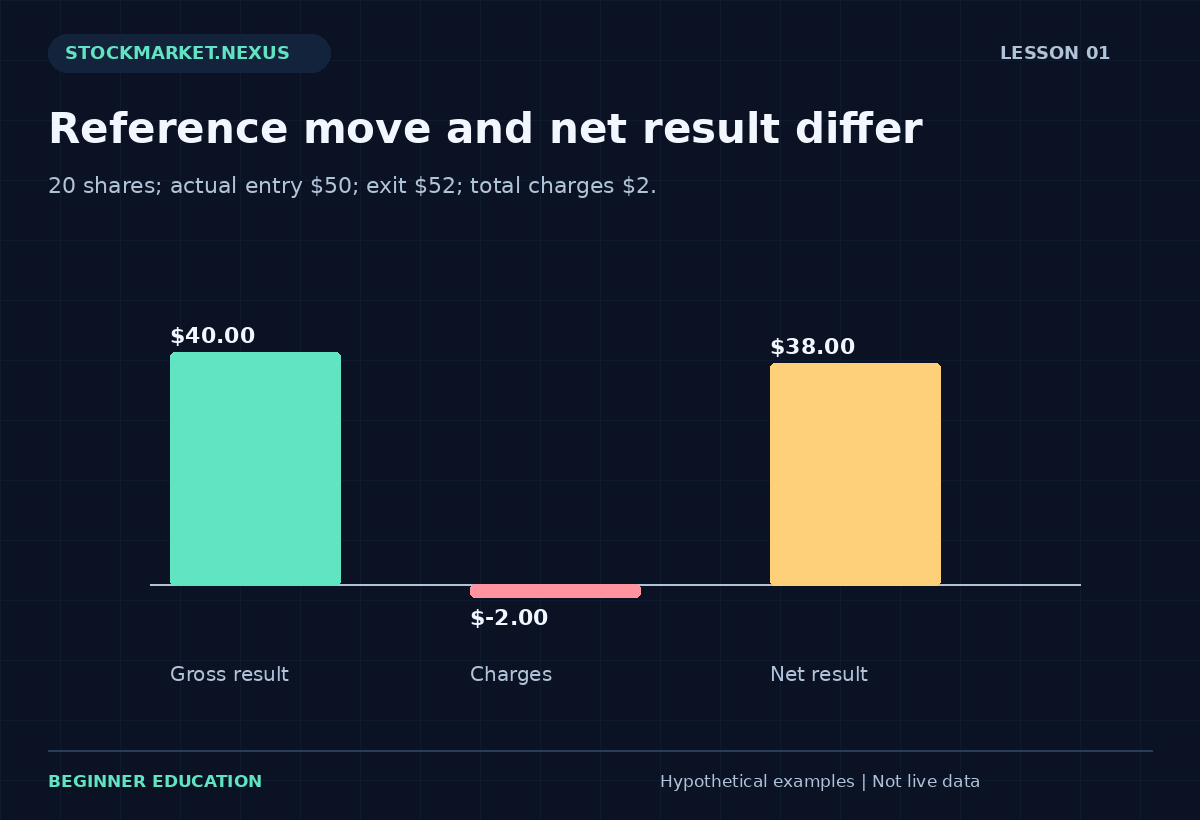
Open the Lesson 1 practice exercise. Start with entry $50, exit $52, 20 shares, and $2 total charges. The gross result is $40; the net result is $38; the reference change is 4%; the net result divided by the $1,000 entry share value is 3.8%. These values are arithmetic, not a claim that the scenario was tradable.
Change the exit to $49 while keeping the other inputs fixed. Gross loss becomes $20 and net loss becomes $22. The costs have not disappeared because the direction was unfavorable. Next reduce the shares to one. The price move is unchanged, while the fixed charge has a much larger effect relative to position value. This shows why chart direction alone does not settle trade economics.
Finally, change only the entry to $51.80 and restore the exit to $52. The later entry captures less of the same hypothetical advance. Explain the result in words before reading the calculator. A useful answer identifies the fill difference, quantity, fee convention, and denominator without claiming the chart pattern caused the profit.
9. Evaluate evidence rather than collecting persuasive pictures
A historical study needs an eligible population and a method for selecting observations. Looking backward for memorable breakouts selects on the outcome. Starting with a predefined universe and applying a fixed rule across all eligible dates is a stronger starting point, although it still requires careful data and execution assumptions.
Compare the rule with a relevant baseline. A strategy may appear successful during a broad market advance because nearly everything rose. A benchmark comparison asks whether the added complexity changed the result under comparable exposure and timing. Costs, idle cash, holding periods, and drawdowns can make a simple headline return misleading.
Small samples are particularly easy to overinterpret. Ten favorable examples do not establish a stable probability for the next trade. A rule selected from hundreds of alternatives deserves more skepticism than a single rule specified in advance. The later lesson on backtesting technical strategies develops those issues in a reproducible review process.
10. What a successful first lesson looks like
The goal is to produce a short analysis someone else can reproduce. It should identify the data, state the observation, define the timing, show a calculation, and acknowledge an alternative outcome. It should distinguish a chart reference from a fill and a hypothetical result from evidence about future performance.
A beginner who can explain why a calculation changes when a fee, entry price, or session definition changes is building a stronger foundation than someone memorizing dozens of pattern names. Technical analysis becomes more useful when its claims become narrower, clearer, and testable. The rest of this course builds on that habit through explicit formulas, original diagrams, and dedicated exercises.
Case review: one chart, two execution records
Two hypothetical learners observe the same reference move from $50 to $52. The first records an entry at $50 and exit at $52 for 20 shares with $2 charges, giving $38 net. The second enters at $51.50 and exits at $51.80 for the same quantity and charges, giving $4 net. Their chart observation is shared, but their transaction records differ. Neither result proves that the original chart rule caused the outcome.
Now imagine the second learner reports only the 4% reference move. That description omits the actual fill difference and exaggerates what the position captured. A professional review retains both the reference observation and the transaction ledger. It also identifies whether the example was hypothetical or executed.
The lesson is not that the earliest possible entry is always best. An earlier entry may require acting before a confirmation rule is satisfied and may expose the learner to additional failed cases. The comparison simply demonstrates that signal definition, timing, and execution economics must remain separate fields. A useful research question evaluates the complete rule across all eligible cases rather than judging one attractive move.
A repeatable practice and review protocol
Before changing the example, write down the question you expect the calculation to answer. Copy the input values, units, chronological order where relevant, and the observation time. State whether the values are fictional, historical, or current. The exercises in this course begin with fictional data so the arithmetic can be studied without implying that a real security offers a particular opportunity. A calculator result is only as meaningful as its input definitions.
Predict the direction of one change before pressing the calculation button. Change one input at a time, explain which part of the formula it affects, and compare the result with your prediction. This controlled approach is more informative than changing several fields until an attractive number appears. If the result surprises you, return to the definition and denominator before looking for a market explanation. Arithmetic mistakes and interpretation mistakes require different corrections.
Then test an ordinary alternative and an edge case. An ordinary alternative checks whether you understand the relationship away from the default example. An edge case checks whether a ratio becomes undefined, a sample becomes insufficient, or an input ordering becomes impossible. A clear validation message is a useful result. Do not work around it by entering an unrelated value merely to make the screen produce an answer. First understand which assumption the rejected value violated.
Save a short review with four parts: the observation, the calculation, the interpretation, and the unresolved limitation. Keep those parts separate. The observation records what the supplied data says; the calculation shows how the number was obtained; the interpretation is a conditional hypothesis; the limitation identifies information the exercise does not provide. This structure makes the note understandable to another beginner and makes later revisions easier to audit.
If you extend the example into a paper-trading study, define signal time, decision time, order assumptions, quantity, costs, and review horizon before checking the outcome. Preserve the original version. Record unfavorable cases and skipped cases under the same rules as favorable ones. A chart image can support the record, but it should not replace the actual values and definitions. A successful-looking historical picture is not a substitute for a complete sample.
Finish by explaining the result in plain language without using a pattern name as the explanation. Identify what changed, what stayed fixed, and what the exercise still cannot establish. You have completed the practice when you can reproduce the important arithmetic, recognize an invalid comparison, and describe an alternative outcome. Repeating this process across the course builds a consistent analytical habit while keeping the different formulas and their limitations distinct.
Sources and calculation notes
Primary educational background provides additional context for the topic. The fictional examples, teaching cases, diagrams, and worksheets here are original educational illustrations. Calculation conventions and missing information are stated explicitly; indicator readings do not establish future returns.