

Technical Analysis · Lesson 06 of 15 · Reviewed November 10, 2026
Trading volume measures the quantity reported as traded during a defined interval. It adds a participation dimension to a price chart, but it does not reveal the motives of every participant or establish which side is “winning.” Every completed trade has a buyer and a seller. A rising price with high volume is an observable combination, not proof that all buyers share the same outlook.
Relative volume compares an observation with a chosen baseline. Its usefulness depends on whether the observations are comparable and whether the baseline was defined before reviewing the result. This lesson explains completed-period volume, a transparent RVOL calculation, common comparison errors, and the limits of interpreting participation as prediction.
1. Verify what the volume field counts
For an ordinary share-volume series, the field represents the number of shares reported as traded in the included interval. Dollar turnover is a different measure that incorporates prices. Trade count is different again: one trade of 10,000 shares and one hundred trades of 100 shares have equal share volume but different trade counts.
Check the source’s market coverage, session definition, and reporting conventions. A platform may show consolidated activity, a limited venue, or another instrument-specific measure. Derivatives can use contracts rather than shares. Some markets provide tick activity rather than a complete centralized traded quantity. Do not compare fields merely because both are labeled volume.
Corporate actions and data revisions can affect historical comparability. A split changes share quantities and price units. A consistent adjusted series needs a documented convention. An unexplained spike should prompt a data check before becoming a dramatic chart annotation.
2. Define the relative-volume baseline
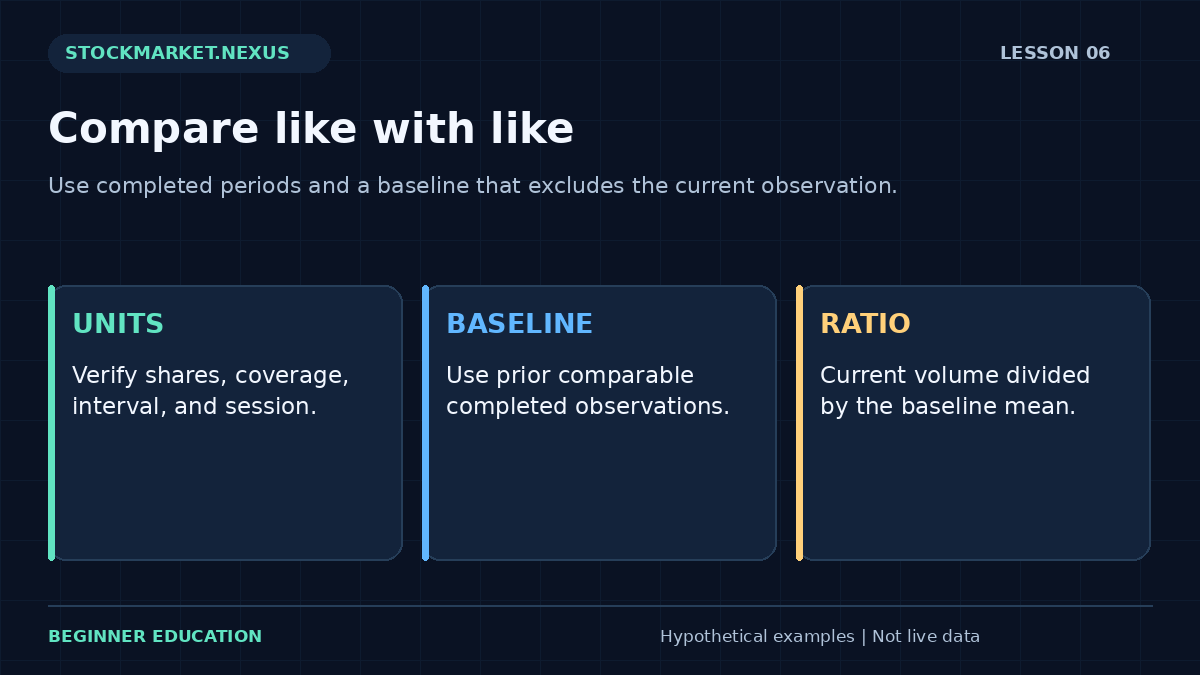
In this lesson, completed-period RVOL equals current completed-period volume divided by the arithmetic mean of a supplied set of earlier completed, comparable periods. The current observation is excluded from the baseline. This is one transparent definition; other platforms can use time-of-day curves, medians, different lookbacks, or other methods.
Suppose the five prior completed volumes are 100,000, 120,000, 80,000, 110,000, and 90,000 shares. Their mean is 100,000. A current completed observation of 150,000 produces RVOL 1.50. That means the current volume is 1.5 times the selected mean, or 50% above it. It is not a 150% increase.
Including the current 150,000 in the average would change the denominator and reduce the ratio. Such a calculation may be a deliberate platform convention, but it is different from this exercise. When reconciling values, compare the baseline membership and timing rather than assuming RVOL has a single universal implementation.

3. Compare completed periods with completed periods
A partial session cannot be compared fairly with a full session without an explicit adjustment. At noon, 60,000 shares may look low relative to a 100,000 full-day average, but the day is not finished. A proper time-of-day comparison would use comparable cumulative volume through the same time on earlier sessions, with consistent session boundaries.
The worksheet deliberately uses completed observations. It does not extrapolate a partial day or claim to model the normal intraday volume curve. If a user enters a partial observation anyway, the arithmetic still produces a number, but the interpretation becomes unreliable because the comparability assumption was broken.
Holidays, shortened sessions, different interval lengths, and missing data create similar problems. A shortened session’s total may be lower simply because less trading time was available. Record these differences and choose an explicit handling rule instead of treating every low total as weak participation.
4. Understand the effect of outliers
An arithmetic mean can be influenced strongly by one unusually large observation. If a news day traded 1,000,000 shares while the other four sessions traded 100,000 each, the five-session mean becomes 280,000. A new 150,000-share day is below that baseline despite being above four of the five individual observations.
This does not make the mean wrong. It explains what the chosen summary emphasizes. A median or trimmed mean would answer a different question. If a study uses one of those alternatives, name it and preserve the method across examples. Switching summaries after seeing the result creates an unrecorded degree of freedom.
The worksheet reports the mean and the individual prior observations so the denominator is visible. A learner should inspect the list before interpreting the ratio. A single polished RVOL value can conceal an unusual baseline.
5. Combine price and volume with careful language
A large price move on above-baseline volume may be relevant to a predefined participation hypothesis. It does not prove that informed institutions are accumulating shares, that the move will continue, or that the next entry has favorable economics. Those are additional claims requiring evidence beyond the ratio.
Likewise, a quiet pullback may be consistent with one interpretation but also reflect a lack of interest, a temporary pause, or a session effect. A chart cannot settle every explanation. Use neutral statements such as “completed volume was 1.5 times the prior five-period mean” before proposing a conditional interpretation.
For breakout studies, define whether volume is measured on the breakout bar, across several bars, or through a specified time. The breakout lesson shows why a participation filter and a price-boundary rule must be evaluated together rather than added after the outcome.
6. Separate activity from executable liquidity
High total volume does not guarantee a narrow spread or sufficient displayed size at the moment an order is submitted. Volume summarizes completed transactions over an interval. Liquidity concerns the terms and quantity available for a particular transaction at a particular time, including the effect of the order itself.
A heavily traded security can still have volatile quotes during an announcement. A large historical daily total cannot tell a small learner exactly where a current market order will fill. Quote age, spread, depth, order type, and market conditions belong in a separate execution review.
Review intraday volume, liquidity, and spreads for the practical distinction. The RVOL worksheet is an educational participation comparison and does not simulate an order book or guarantee a fill.
7. Work through the RVOL exercise
Open the Lesson 6 volume exercise. Enter prior completed volumes 100000, 120000, 80000, 110000, 90000 and current completed volume 150000. Predict the mean and ratio before calculating. The result should show 100,000 baseline shares, 1.50 times relative volume, and a 50% difference from the mean.
Change only the current volume to 50,000. RVOL becomes 0.50 and the difference becomes minus 50%. Next restore 150,000 and replace one prior observation with 1,000,000. Explain why the current ratio falls. The change comes from the denominator, not a change in current participation.
A baseline consisting entirely of zeros should produce an error because division by a zero mean is undefined. Individual zero observations are allowed when they are valid data, but their meaning should be investigated. Negative share volumes and malformed lists are rejected. Input validation cannot verify that an apparently valid number came from the correct market session.
8. Use the graphic to inspect the denominator
The exercise displays the earlier observations and current observation as a simple volume series, alongside the baseline value. This makes it easier to notice an outlier that a single ratio could hide. It is a fictional series with no current-market feed, and the chart has no directional price signal.
Try several lists with the same mean but different dispersion. For example, five equal 100,000 observations and a varied list averaging 100,000 produce the same ratio for current volume 150,000. Their consistency differs even though RVOL is identical. A useful analyst inspects the observations behind the summary.
This principle also appears in Bollinger Bands and dispersion. Two samples can share an average while differing substantially in variation. A summary statistic is useful when its omissions are understood.
9. Design a participation study that can be reviewed
Specify the instrument universe, interval, session, baseline window, treatment of exceptional sessions, threshold, and observation horizon. If the question is whether high-volume breakouts behave differently, define both high volume and breakout before collecting examples. Record low-volume cases too so the comparison has a meaningful denominator.
Do not assume a threshold such as 1.5 is optimal because it is easy to remember. A threshold is a chosen parameter. If many thresholds are tested, preserve that search history and evaluate the selected rule on observations not used to choose it. A visually persuasive filter can still fail after realistic costs.
Keep volume evidence separate from causal explanations. A study might document an association between a defined volume condition and later price behavior without establishing who caused the movement or why. Narrow conclusions are easier to defend and more useful to beginners than confident stories about unseen participants.
10. Review what RVOL can and cannot tell you
You should be able to reproduce the denominator, exclude the current observation under this convention, distinguish times from percentage increase, and explain why partial sessions need a different comparison. You should also understand why activity is not the same as current liquidity.
A professional volume review makes the units and comparison periods visible. It uses participation as one measured feature of a broader study and avoids converting a ratio into a promise about direction. That discipline makes the indicator easier to compare across platforms and much harder to misuse.
Case review: a baseline altered by one exceptional session
Use prior completed volumes 100000, 100000, 100000, 100000, 100000. A current 150000 observation has RVOL 1.50. Replace one prior observation with 1000000. The new mean is 280000, so the same current volume produces RVOL about 0.536. Current activity did not change; the comparison sample did.
Neither ratio is arithmetically wrong. They describe different baselines. A professional note states the lookback and explains whether exceptional sessions remain in the sample. Removing an outlier only because it makes the current ratio less exciting would change the method after seeing the answer.
For an additional check, multiply every volume by ten. Both the current observation and the mean scale together, leaving RVOL unchanged. This verifies that the ratio is scale-invariant under a common multiplier. It does not verify that the underlying units are comparable. Mixing shares with contracts or partial sessions with completed sessions remains an interpretation error even when the arithmetic is flawless.
A repeatable practice and review protocol
Before changing the example, write down the question you expect the calculation to answer. Copy the input values, units, chronological order where relevant, and the observation time. State whether the values are fictional, historical, or current. The exercises in this course begin with fictional data so the arithmetic can be studied without implying that a real security offers a particular opportunity. A calculator result is only as meaningful as its input definitions.
Predict the direction of one change before pressing the calculation button. Change one input at a time, explain which part of the formula it affects, and compare the result with your prediction. This controlled approach is more informative than changing several fields until an attractive number appears. If the result surprises you, return to the definition and denominator before looking for a market explanation. Arithmetic mistakes and interpretation mistakes require different corrections.
Then test an ordinary alternative and an edge case. An ordinary alternative checks whether you understand the relationship away from the default example. An edge case checks whether a ratio becomes undefined, a sample becomes insufficient, or an input ordering becomes impossible. A clear validation message is a useful result. Do not work around it by entering an unrelated value merely to make the screen produce an answer. First understand which assumption the rejected value violated.
Save a short review with four parts: the observation, the calculation, the interpretation, and the unresolved limitation. Keep those parts separate. The observation records what the supplied data says; the calculation shows how the number was obtained; the interpretation is a conditional hypothesis; the limitation identifies information the exercise does not provide. This structure makes the note understandable to another beginner and makes later revisions easier to audit.
If you extend the example into a paper-trading study, define signal time, decision time, order assumptions, quantity, costs, and review horizon before checking the outcome. Preserve the original version. Record unfavorable cases and skipped cases under the same rules as favorable ones. A chart image can support the record, but it should not replace the actual values and definitions. A successful-looking historical picture is not a substitute for a complete sample.
Finish by explaining the result in plain language without using a pattern name as the explanation. Identify what changed, what stayed fixed, and what the exercise still cannot establish. You have completed the practice when you can reproduce the important arithmetic, recognize an invalid comparison, and describe an alternative outcome. Repeating this process across the course builds a consistent analytical habit while keeping the different formulas and their limitations distinct.
Sources and calculation notes
Primary educational background provides additional context for the topic. The fictional examples, teaching cases, diagrams, and worksheets here are original educational illustrations. Calculation conventions and missing information are stated explicitly; indicator readings do not establish future returns.