

Technical Analysis · Lesson 12 of 15 · Reviewed November 10, 2026
A breakout describes price moving beyond a previously defined boundary. The phrase sounds simple, but its meaning changes with the boundary, observation type, timeframe, and confirmation rule. A single intraday print, a completed close, and a close beyond a buffer are different events. A professional lesson starts by defining the event rather than collecting dramatic examples after they succeed.
This lesson develops a boundary-based exercise that distinguishes location, a chosen confirmation observation, entry limits, and planned reward-risk geometry. It does not identify live opportunities or estimate a reliable probability of continuation. Its purpose is to help beginners write a plan that remains understandable when price behaves unexpectedly.
1. Fix the reference range before the test
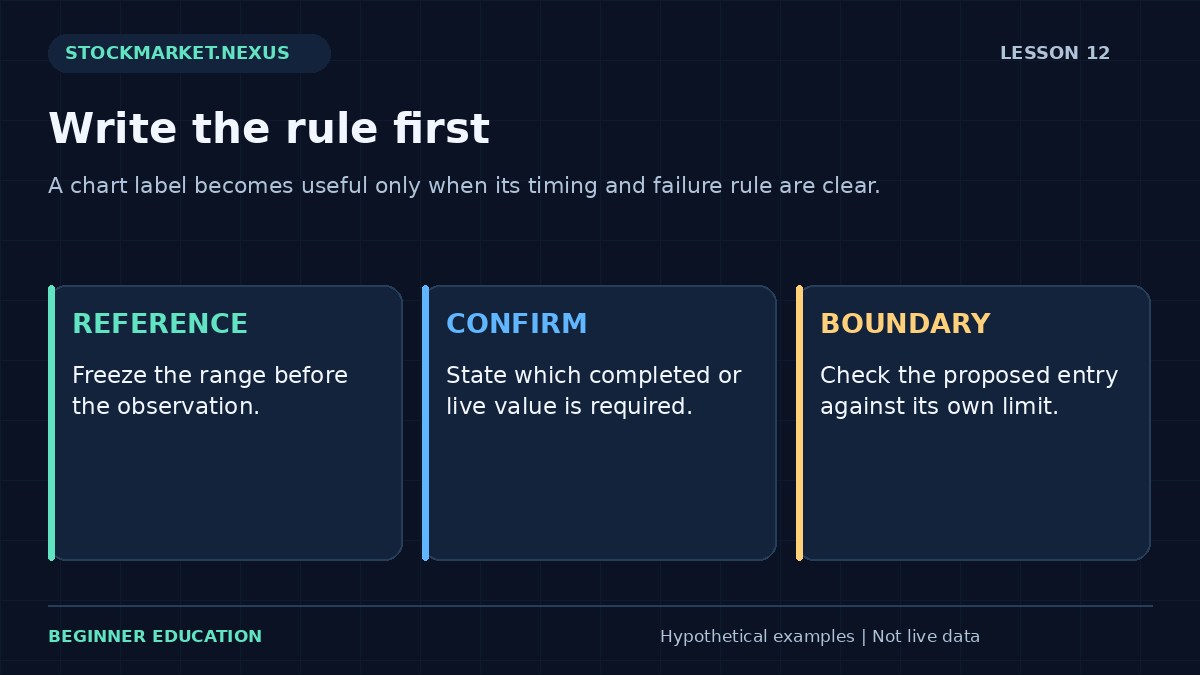
A range needs a lower and upper boundary derived from a stated sample. For example, a fictional study might use the highest high and lowest low of ten prior completed daily bars. Those boundaries remain fixed during the next bar’s test. Including the evolving current bar would create a different rule with a moving boundary.
The boundaries can also come from a documented historical zone, but the selection method must be clear. A line drawn through the most convenient past points after seeing a rally is not equivalent to a reference selected beforehand. Preserve the original values and the time at which they became available.
The support and resistance lesson explains how zones express uncertainty without pretending to be guaranteed barriers. The breakout worksheet uses a fixed range for one observation and does not discover historical levels automatically.
2. Name the observation that confirms the event
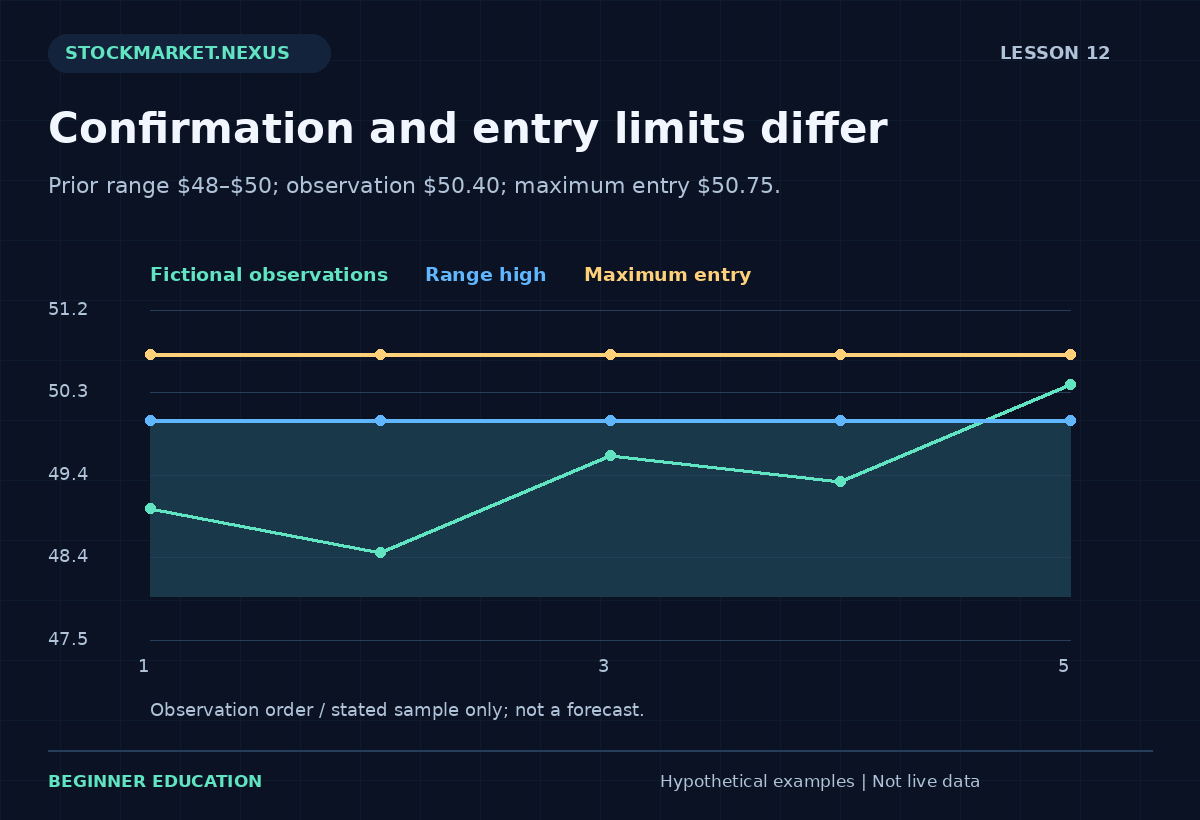
Suppose range high is $50 and range low is $48. A reference observation of $50.40 is above the range. If the study requires a completed daily close, that observation should be the completed close, not a momentary quote during the session. The worksheet cannot verify the source; it labels the user’s selected confirmation observation.
A buffer can be studied as an additional condition, but it should have an explicit unit. A fixed dollar buffer, a percentage buffer, and a volatility-based buffer are different methods. Testing many alternatives and retaining only the best historical result requires independent evaluation afterward.
Confirmation is a rule definition, not a guarantee. Waiting for a close can reduce some temporary intrabar events while creating later entries and different costs. There is no free confirmation that removes all uncertainty. Evaluate the complete timing tradeoff rather than describing a later signal as automatically safer.
3. Define a false break without hindsight
A false break must be tied to a stated failure criterion and horizon. One study might label a break false if the next completed close returns inside the old range. Another might require a move below the lower boundary within five sessions. These definitions capture different events and produce different counts.
A breakout that pauses for two sessions and later advances may be a failure under a short time rule and a success under a longer one. Neither label is meaningful without the original horizon. Avoid changing the horizon after seeing the path merely to preserve the story.
Record the first qualifying event and decide how repeated attempts are handled. Counting the final successful break while ignoring two earlier failed attempts understates turnover and loss. Every eligible event belongs in the study, including those that look unremarkable in a final chart.
4. Separate a chart event from an entry instruction
A confirmation observation can occur above the range while a proposed entry exceeds a learner’s prewritten maximum price. Those are compatible statements: the event occurred, but the proposed entry does not fit the stated boundary. A professional tool should make both visible rather than treating every breakout as permission to chase.
Suppose the range is $48–$50, confirmation observation $50.40, proposed entry $50.50, and maximum entry $50.75. The proposal is within that self-imposed maximum. If proposed entry rises to $51.20, it is outside the maximum even though the confirmation observation still qualifies.
“Within maximum” describes compliance with an entered rule, not suitability or a recommendation. A limit order at a maximum price may not fill, and an order submitted later may face a different market. Review market, limit, and stop orders before turning a hypothetical entry boundary into an execution assumption.
5. Calculate planned geometry independently
For a long-side educational scenario, planned risk distance is proposed entry minus planned exit reference, and planned reward distance is target minus entry. With entry $50.50, exit reference $49, and target $54, the distances are $1.50 and $3.50, producing a gross planned reward-risk ratio about 2.33.
This ratio is geometry under stated prices. It does not tell the learner the chance of reaching either level, the order in which levels might be reached, or the actual fill. Costs reduce favorable results and increase losses. A gap can produce a worse exit than the planned reference.
A higher target can make the displayed ratio larger without making the target more likely. A tighter exit can do the same while increasing sensitivity to ordinary fluctuation. Choose levels because they belong to a defined hypothesis and evaluate them across a sample, rather than adjusting them until the ratio looks attractive.
6. Add participation as a separately tested condition
Some methods require above-baseline volume during a break. If so, define the volume window and comparison convention. A partial-day volume total cannot be compared casually with full-day averages. A completed-bar price condition and a partially formed volume condition need careful timing alignment.
The volume and relative-volume lesson provides a transparent completed-period comparison. A volume filter can be a research feature, but it does not prove that the breakout will continue or that current liquidity is adequate for a particular order.
Other filters create similar responsibilities. Wider trend, volatility, time of day, and event calendars may be relevant, but adding conditions after reviewing outcomes expands the historical search. Preserve those choices and test whether the added complexity contributes useful information.
7. Work through the breakout-boundary exercise
Open the Lesson 12 breakout exercise. Enter range low 48, range high 50, confirmation observation 50.4, proposed entry 50.5, maximum entry 50.75, planned exit 49, and target 54. The result should identify the observation above the range, the proposal within the maximum, and planned reward-risk near 2.33.
Change the proposed entry to 51.2. The proposal now exceeds the maximum and the planned ratio falls because reward distance shrinks while risk distance grows. The tool should describe both changes without issuing an instruction to place a trade. The user’s hypothetical rule remains the reference.
Next move the confirmation observation to 49.8. It is inside the range and does not meet this exercise’s strict above-range condition. A value exactly equal to range high is also not strictly above it. Test an invalid exit above entry or target below entry; the worksheet should explain the required long-side ordering.
8. Preserve the execution timeline
Write separate times for boundary availability, confirmation, decision, order submission, and fill. A backtest can accidentally observe a completed bar and assume a fill earlier inside it. That sequence uses information that was not available at the assumed execution time.
If a bar contains both planned exit and target, OHLC may not reveal which came first. Use finer information where appropriate or state a conservative ambiguity convention. The full high-low range is not a chronological path, as the candlestick lesson explains.
Include nonfills and skipped proposals. A limit-price rule can look excellent if the review counts only examples that later traded favorably, while ignoring missed entries or partial execution. A complete study preserves the practical consequences of the instruction, not only the attractive chart event.
9. Review favorable and unfavorable paths symmetrically
For every eligible event, measure the same horizon and the same outcome fields. Record return, adverse excursion, favorable excursion, time in the study, costs, and whether execution was possible under the assumed rule. Keep event-driven gaps and ordinary range failures rather than excluding them because they complicate the narrative.
A breakout can fail even when the initial analysis was competently documented. Conversely, an undisciplined late entry can profit by chance. Review rule compliance separately from the outcome. Otherwise a lucky result can reinforce a process that was never clearly defined.
The next useful question is whether the complete method adds value beyond a relevant baseline across different conditions. A collection of successful breakout images cannot answer that question because it lacks the eligible denominator and unfavorable cases.
10. Use confirmation to clarify the study
You should be able to define the range, distinguish strict crossing from touching, identify the chosen confirmation observation, compare a proposed entry with its maximum, and calculate the planned long-side distances. You should also explain why those distances are not probabilities or guaranteed fills.
A good breakout plan remains readable after a false break. Its original boundaries, timing, and failure criteria still make sense even when the outcome disappoints. That consistency is the professional benefit of defining confirmation before the move rather than inventing it afterward.
Case review: confirmation arrives after an attractive price
A range high is $50. During a session, price briefly trades at $50.10, then finishes at $50.80. A rule requiring the completed close cannot know its confirmation at the earlier $50.10 print. Assuming an entry at that earlier price because the day eventually confirmed uses later information.
A different intraday rule could act on the first print, but it would also include cases that later closed back inside the range. Those failed cases belong to its sample. The two designs should be compared as different rules rather than combining the early entry from one with the confirmation certainty of the other.
For your review, create a timeline with the boundary-known time, first crossing, completed observation, decision, and hypothetical fill. This often exposes hidden assumptions more clearly than a performance chart. The purpose of confirmation is to define what information the method requires. It does not provide a free improvement in entry quality, remove nonfills, or guarantee that the next price movement continues beyond the boundary.
A repeatable practice and review protocol
Before changing the example, write down the question you expect the calculation to answer. Copy the input values, units, chronological order where relevant, and the observation time. State whether the values are fictional, historical, or current. The exercises in this course begin with fictional data so the arithmetic can be studied without implying that a real security offers a particular opportunity. A calculator result is only as meaningful as its input definitions.
Predict the direction of one change before pressing the calculation button. Change one input at a time, explain which part of the formula it affects, and compare the result with your prediction. This controlled approach is more informative than changing several fields until an attractive number appears. If the result surprises you, return to the definition and denominator before looking for a market explanation. Arithmetic mistakes and interpretation mistakes require different corrections.
Then test an ordinary alternative and an edge case. An ordinary alternative checks whether you understand the relationship away from the default example. An edge case checks whether a ratio becomes undefined, a sample becomes insufficient, or an input ordering becomes impossible. A clear validation message is a useful result. Do not work around it by entering an unrelated value merely to make the screen produce an answer. First understand which assumption the rejected value violated.
Save a short review with four parts: the observation, the calculation, the interpretation, and the unresolved limitation. Keep those parts separate. The observation records what the supplied data says; the calculation shows how the number was obtained; the interpretation is a conditional hypothesis; the limitation identifies information the exercise does not provide. This structure makes the note understandable to another beginner and makes later revisions easier to audit.
If you extend the example into a paper-trading study, define signal time, decision time, order assumptions, quantity, costs, and review horizon before checking the outcome. Preserve the original version. Record unfavorable cases and skipped cases under the same rules as favorable ones. A chart image can support the record, but it should not replace the actual values and definitions. A successful-looking historical picture is not a substitute for a complete sample.
Finish by explaining the result in plain language without using a pattern name as the explanation. Identify what changed, what stayed fixed, and what the exercise still cannot establish. You have completed the practice when you can reproduce the important arithmetic, recognize an invalid comparison, and describe an alternative outcome. Repeating this process across the course builds a consistent analytical habit while keeping the different formulas and their limitations distinct.
Sources and calculation notes
Primary educational background provides additional context for the topic. The fictional examples, teaching cases, diagrams, and worksheets here are original educational illustrations. Calculation conventions and missing information are stated explicitly; indicator readings do not establish future returns.