

Technical Analysis · Lesson 13 of 15 · Reviewed November 10, 2026
A stock can rise while lagging its benchmark, or fall while outperforming a benchmark that fell more. Relative strength in this comparison means performance relative to another series over aligned observations. It is different from the Relative Strength Index, which compares upward and downward changes within one series.
This lesson uses rebased price indices to make the distinction visible. Both series start at 100, allowing their percentage changes to be compared without confusing different share prices. The dedicated exercise calculates endpoint returns, percentage-point difference, and relative wealth ratio under a clearly stated price-return convention.
1. Choose a benchmark that fits the question
A broad market index, a sector reference, and a peer security answer different questions. The benchmark should match the research objective and be selected before reviewing which comparison makes the stock look strongest. A technology business compared with a broad market reference and with a technology-sector reference can produce different relative conclusions.
Consider currency, trading calendar, market hours, and instrument structure. A foreign security and a domestic benchmark can embed currency effects and nonoverlapping sessions. A stock and a leveraged product have different exposure mechanics. A convenient chart overlay is not automatically an appropriate economic comparison.
The worksheet does not select a benchmark or evaluate its suitability. It assumes the learner supplies two aligned, comparable price series. Naming that assumption prevents a mathematically correct ratio from being mistaken for a complete investment assessment.
2. Align dates and return conventions
Each observation in the stock list should correspond to the same observation time in the benchmark list. Different holidays or market closing times can create apparent relative changes that partly reflect timing. Do not fill missing observations casually without documenting the method and its consequences.
Price return and total return are different conventions. A price-only series omits cash distributions unless its adjustment method incorporates them. A total-return comparison includes reinvestment assumptions and requires consistent treatment on both sides. Mixing a stock’s unadjusted price return with a benchmark’s total return can bias the comparison.
This exercise uses supplied positive prices and labels the result as price return. It does not add dividends, financing, taxes, or currency conversion. If adjusted prices are used, the user must understand the provider’s convention rather than assuming every adjusted series means the same thing.
3. Rebase both series to 100
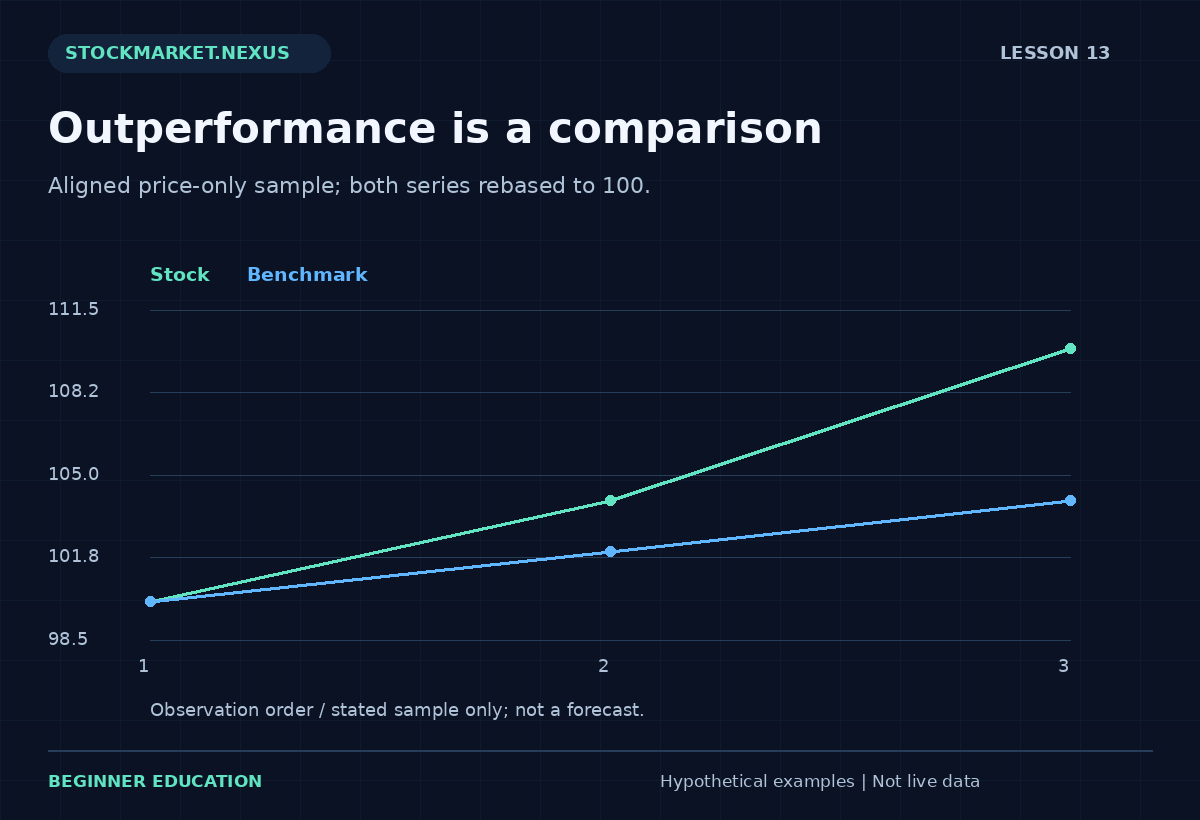
A rebased value equals current price divided by the first supplied price, multiplied by 100. Suppose stock prices are 50, 52, 55 and benchmark prices are 100, 102, 104. The stock’s rebased path is 100, 104, 110. The benchmark’s path is 100, 102, 104.
The starting share prices do not determine the comparison. A $50 stock is not inherently cheaper than a $100 benchmark instrument, and its lower nominal price does not imply greater return potential. Rebasing removes that nominal scale difference so percentage movement is easier to inspect.
The endpoint stock price return is 10%, while benchmark return is 4%. The stock’s return exceeds the benchmark’s by six percentage points. That difference should not be called a 6% relative return without defining what relative means, because a ratio-based comparison produces a different number.
4. Distinguish percentage points from relative wealth
Relative wealth ratio equals the stock’s growth factor divided by the benchmark’s growth factor. In the example, 1.10 ÷ 1.04 is approximately 1.05769. Relative wealth change is therefore about 5.77%. This differs from the six-percentage-point arithmetic return gap.
Both calculations can be useful if labeled correctly. The percentage-point gap compares two returns directly. The wealth ratio compares how much one normalized ending value exceeds the other proportionally. Neither is the same as a realized long-short trade return, which would require position sizes, financing, borrowing, rebalancing, and costs.
A chart of stock price divided by benchmark price also depends on nominal units, although its percentage change across matched dates reflects the relative growth relationship. Rebasing the ratio can improve readability. The exercise reports the endpoint ratio and plots the two rebased series rather than implying an executable spread strategy.
5. Understand outperformance during a decline
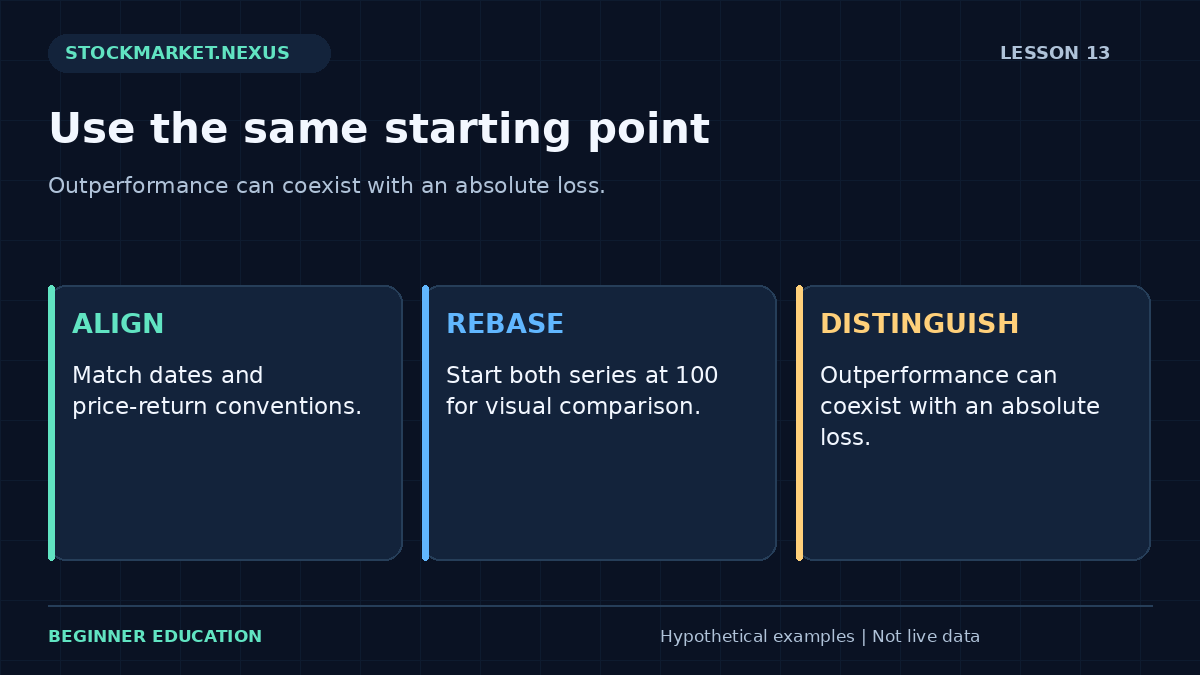
Suppose the stock falls from $50 to $45, a 10% loss, while the benchmark falls from $100 to $80, a 20% loss. The stock outperforms by ten percentage points, yet an unhedged holder still experiences a negative price return. Relative success and absolute profit are different statements.
Relative wealth ratio is 0.90 ÷ 0.80 = 1.125, or a 12.5% relative wealth increase. That does not erase the stock’s 10% decline. A professional explanation reports both absolute returns and the relative comparison so a beginner does not mistake “stronger than the market” for “making money.”
The reverse can happen in a rising market. A stock up 5% underperforms a benchmark up 15% despite producing a positive price return. Benchmarking adds context; it does not replace the investor’s actual cash outcome or objectives.
6. Keep relative strength separate from RSI
RSI uses gains and losses within one series and usually appears on a bounded 0–100 scale. Benchmark relative strength compares two series and is not bounded in the same way. Similar names do not make the calculations interchangeable.
A stock could have elevated RSI while lagging a benchmark that rose even faster. It could have a weak RSI during a broad decline while still losing less than the benchmark. These combinations are not contradictions because the measurements address different questions.
Review RSI and Wilder’s calculation for the single-series method. In a journal, label the benchmark comparison explicitly rather than writing only “RS strong,” which can leave the reader unsure which concept was intended.
7. Use the benchmark-comparison exercise
Open the Lesson 13 relative-strength exercise. Enter stock prices 50, 52, 55 and benchmark prices 100, 102, 104. Predict ending rebased values 110 and 104, returns 10% and 4%, gap six percentage points, and relative wealth change about 5.77%.
Change the lists to stock 50, 48, 45 and benchmark 100, 90, 80. The chart should show both series below 100 while the stock finishes above the benchmark. Explain the absolute loss and relative outperformance together before reading the labels.
The lists must have equal length and positive values. A zero initial price makes the growth factor undefined and is rejected. The tool cannot verify date alignment or distribution adjustments, so the input instructions remain part of the exercise. Valid numbers alone do not establish a valid comparison.
8. Inspect the full path, not only the endpoint
Two stocks can have identical endpoint returns while experiencing different drawdowns and volatility. A benchmark comparison based only on start and finish omits that path. The rebased chart helps reveal intermediate differences, but a complete performance review needs additional risk and exposure measurements.
A stock that briefly outperforms and then gives back the advantage is different from one that steadily gains relative ground, even if the final ratio matches. Define whether a study examines endpoint return, persistence, ranking, or a specific relative-strength rule. Those are separate questions.
The trend structure lesson explains why descriptions depend on selected observations and confirmation. A relative chart can also have trends and pivots, but their interpretation must remain tied to the ratio rather than silently transferred to absolute price.
9. Avoid benchmark selection and survivorship bias
Choosing a benchmark after seeing results can make performance appear better than it would under a preselected reference. Preserve the original benchmark and explain any change. If several alternatives are relevant, report them as separate comparisons instead of presenting only the most favorable one.
A universe containing only today’s surviving or successful securities can overstate the historical usefulness of a relative-strength selection method. Delisted, merged, or failed instruments may belong in the original eligible population. Data availability should not quietly determine which unfavorable examples disappear.
Ranking rules also need timing. A ranking calculated using a completed month cannot justify an earlier purchase within that month. The backtesting lesson explains why aligned information times, eligible populations, and realistic execution assumptions are essential to a credible historical test.
10. Report a balanced comparison
A useful note names the benchmark, date range, data convention, both absolute returns, the percentage-point gap, and the relative wealth ratio. It also states whether distributions and currency effects are included. That short set of fields prevents several common interpretation errors.
You should be able to explain why nominal share prices are irrelevant to the rebased starting point, why outperformance can coexist with a loss, and why a return gap differs from a growth-factor ratio. Those distinctions make benchmark analysis informative without turning relative performance into an unsupported recommendation about the next trade.
Case review: relative improvement during an absolute loss
A stock falls from 50 to 45 while the benchmark falls from 100 to 80. Rebased values finish at 90 and 80. The stock loses 10% and the benchmark loses 20%, producing ten percentage points of outperformance and a relative wealth gain of 12.5%. Report all three facts together.
A headline saying only that relative strength improved can leave a beginner believing the stock made money. A headline saying only that the stock fell can omit useful benchmark context. The professional explanation preserves both absolute and relative outcomes without treating either as a forecast.
Now switch the benchmark endpoint to 95 while keeping the stock unchanged. The stock still loses 10%, but it underperforms the benchmark’s 5% loss. This controlled change shows that relative strength depends on the selected comparison. It is not a property of the stock alone. Keep the benchmark choice and aligned observation dates in the record so later readers can understand exactly what the relative statement means.
A repeatable practice and review protocol
Before changing the example, write down the question you expect the calculation to answer. Copy the input values, units, chronological order where relevant, and the observation time. State whether the values are fictional, historical, or current. The exercises in this course begin with fictional data so the arithmetic can be studied without implying that a real security offers a particular opportunity. A calculator result is only as meaningful as its input definitions.
Predict the direction of one change before pressing the calculation button. Change one input at a time, explain which part of the formula it affects, and compare the result with your prediction. This controlled approach is more informative than changing several fields until an attractive number appears. If the result surprises you, return to the definition and denominator before looking for a market explanation. Arithmetic mistakes and interpretation mistakes require different corrections.
Then test an ordinary alternative and an edge case. An ordinary alternative checks whether you understand the relationship away from the default example. An edge case checks whether a ratio becomes undefined, a sample becomes insufficient, or an input ordering becomes impossible. A clear validation message is a useful result. Do not work around it by entering an unrelated value merely to make the screen produce an answer. First understand which assumption the rejected value violated.
Save a short review with four parts: the observation, the calculation, the interpretation, and the unresolved limitation. Keep those parts separate. The observation records what the supplied data says; the calculation shows how the number was obtained; the interpretation is a conditional hypothesis; the limitation identifies information the exercise does not provide. This structure makes the note understandable to another beginner and makes later revisions easier to audit.
If you extend the example into a paper-trading study, define signal time, decision time, order assumptions, quantity, costs, and review horizon before checking the outcome. Preserve the original version. Record unfavorable cases and skipped cases under the same rules as favorable ones. A chart image can support the record, but it should not replace the actual values and definitions. A successful-looking historical picture is not a substitute for a complete sample.
Finish by explaining the result in plain language without using a pattern name as the explanation. Identify what changed, what stayed fixed, and what the exercise still cannot establish. You have completed the practice when you can reproduce the important arithmetic, recognize an invalid comparison, and describe an alternative outcome. Repeating this process across the course builds a consistent analytical habit while keeping the different formulas and their limitations distinct.
Sources and calculation notes
Primary educational background provides additional context for the topic. The fictional examples, teaching cases, diagrams, and worksheets here are original educational illustrations. Calculation conventions and missing information are stated explicitly; indicator readings do not establish future returns.