


Risk Management · Lesson 09 of 15 · Reviewed November 10, 2026
Holding many securities does not automatically create broad diversification. Several positions can represent the same issuer, sector, geography, economic driver, or underlying fund holdings. Concentration risk concerns how much of the portfolio depends on a limited set of exposures, including exposures that are not obvious from ticker count.
This lesson starts with a simple value-weighted concentration exercise and then explains what that exercise cannot see. The tool calculates holding weights, the largest weight, and a concentration index from supplied nonnegative values. It does not assess whether an allocation is suitable or claim that a lower index guarantees protection.
1. Define the portfolio being measured
A concentration measure needs a complete denominator. If the list includes only selected stock holdings but omits cash, bonds, funds, or liabilities, its weights describe that subset rather than the whole financial picture. Label the scope before interpreting the result.
Use a consistent valuation time and currency. Mixing yesterday’s value for one holding with today’s for another can distort weights during volatility. A foreign-currency position also needs an explicit conversion convention if the list is expressed in one account currency.
The exercise assumes supplied current values for a long-only, nonnegative list. It is not a net-exposure model for shorts, derivatives, or leverage. Those structures require additional information beyond a list of positive market values.
2. Calculate the holding weights
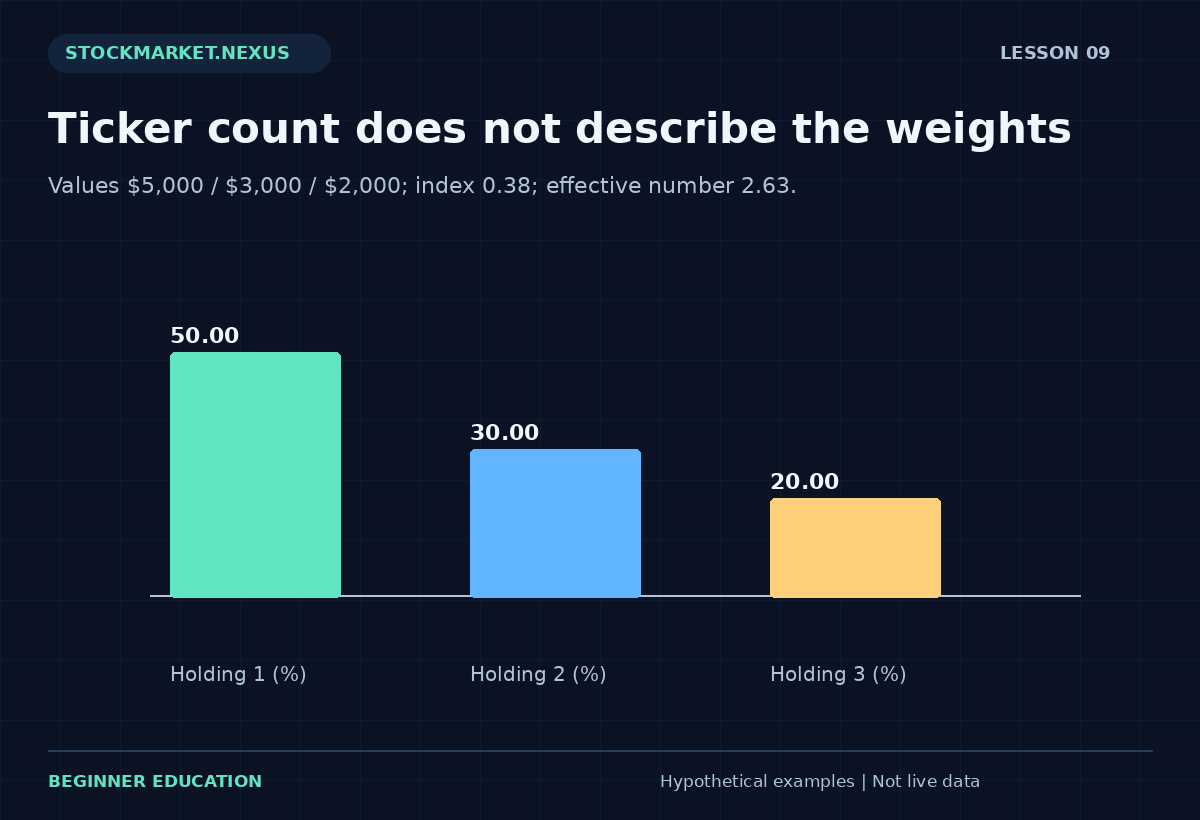
Each weight equals a holding’s value divided by the sum of included values. Values 5000, 3000, and 2000 sum to 10000 and produce weights 50%, 30%, and 20%. The largest included holding is therefore half the selected portfolio.
A count of three does not reveal this distribution. Three equal holdings would have different weights from the 50/30/20 example. Ten holdings can still be dominated by one large position. Weighting adds information that a simple count omits.
Zero-value entries contribute no weight. A list with total value zero cannot produce meaningful weights and should be rejected. The calculator cannot verify whether a zero means no holding, a missing valuation, or an omitted record; that distinction belongs in the input review.
3. Calculate a simple concentration index
The worksheet sums squared fractional weights. For weights 0.5, 0.3, and 0.2, the index is 0.25 + 0.09 + 0.04 = 0.38. A corresponding effective-number summary is one divided by the index, approximately 2.63.
For three equal positive weights, the index is one third and the effective number is three. For a single holding, the index is one and effective number one. These are mathematical descriptions of the value distribution, not risk-adjusted counts of independent exposures.
The effective number should not be called the number of genuinely diversified bets. Three equal technology holdings can still share substantial economic drivers. The index knows the weights but not the relationships among the holdings.
4. Look through funds and overlapping exposures
A broad fund can contain a company also held directly. A sector fund can overlap with several individual positions and another fund. Counting each wrapper as a separate exposure can conceal the same issuer appearing repeatedly.
A look-through review needs current underlying holdings and weights from reliable disclosures. The simple worksheet does not fetch them or combine them automatically. It can help describe a supplied value list, but it cannot certify diversification from fund names alone.
The joint-stress lesson shows another way to examine shared drivers through explicit scenarios. Weight concentration and common-shock exposure answer different questions and should both remain visible.
5. Recognize concentration created by performance
A position can become dominant without a new purchase if it appreciates faster than the rest. Starting weights therefore do not describe the portfolio indefinitely. A periodic review should use current values and compare them with the original policy.
A strong performer may also increase emotional attachment, making its growing weight seem less important. The review should remain numerical and objective: what fraction of the included portfolio depends on this holding now, and what would an adverse move mean for the whole?
Rebalancing can involve taxes, costs, liquidity, and personal objectives. The worksheet does not recommend a sale or a target allocation. It supplies measurements that can support a broader decision process.
6. Use the dedicated concentration exercise
Open the Lesson 9 concentration exercise. Enter values 5000, 3000, 2000. Predict weights 50%, 30%, 20%, index 0.38, and effective number about 2.63. The graphic displays the weight distribution rather than pretending to show independent risk contributions.
Replace the list with 3333, 3333, 3333. The weights become equal and the effective number becomes three. Next enter 9000, 100, 100, 100, 100, 100, 100, 100, 100, 200. There are ten entries, but one dominates the value distribution.
Finally consider what happens if all ten holdings belong to the same narrow sector. The calculator output alone cannot identify that economic overlap. Write the missing information beside the numerical result instead of assuming a larger count resolved the concentration question.
7. Distinguish diversification from loss prevention
Diversification can reduce dependence on particular holdings or drivers, but it does not eliminate market losses. Several assets can decline together, especially under broad stress. A portfolio with lower value concentration can still experience substantial drawdown.
The drawdown lesson explains how the resulting account decline and recovery requirement are measured. A concentration index is not a substitute for a portfolio path or an adverse scenario.
Avoid treating a historical correlation estimate as fixed protection. Relationships can change, and a narrow sample may not represent a future event. A scenario review can ask what happens if usual offsets weaken without claiming that the scenario has a known probability.
8. Include financial and operational dependencies
An employer-stock position can overlap with employment income. A portfolio focused on one region can overlap with property or business exposure there. These broader dependencies may matter even though they are not securities in the same account.
Liquidity concentration is another issue. Several holdings may be difficult to sell promptly or may impose constraints. A nominally balanced value list can still leave little accessible cash when needed. The liquidity lesson distinguishes market value from executable proceeds.
The exercise does not collect sensitive personal data or infer these dependencies. It teaches the habit of asking what the measured list leaves out. That habit is more useful than presenting a single score as a complete assessment.
9. Case review: equal weights, one underlying driver
Imagine four equal $2,500 holdings: two individual chipmakers, a semiconductor fund, and a technology fund with substantial related exposure. The value concentration index is 0.25 and effective number four. Those numbers accurately describe the four wrapper weights but do not establish four independent economic exposures.
A look-through review could reveal repeated issuer and industry weights. A joint adverse scenario could show all four declining together. Neither finding makes the original arithmetic wrong; it narrows what the arithmetic was capable of describing.
For practice, create two labels for each entry: its account wrapper and its main underlying driver. Keep the weight chart, then add a written overlap review. This produces a more professional explanation than either dismissing all concentration measures or treating an attractive distribution as proof that the portfolio is protected.
Review challenge: a dominant holding grows through performance
A portfolio begins with four equal $2,500 values. One doubles to $5,000 while the others stay unchanged. Total value becomes $12,500, and the larger holding now represents 40%, while each other holding represents 20%. No new purchase was needed to create the concentration change.
The squared-weight index rises from 0.25 to 0.28, and effective-number summary falls from four to about 3.57. These numbers describe the value distribution. They still do not identify whether the four holdings share one issuer, sector, or other economic driver.
Now imagine the larger holding is also the employer of the account owner. The broader financial dependency includes income exposure that the security-value list does not measure. The worksheet should not pretend to know that context or issue a personal allocation verdict.
For practice, preserve the original and current weights and write a separate overlap note. Distinguish a measurement from a rebalancing decision, which can involve costs, taxes, liquidity, and personal objectives. A professional concentration review makes the growing dependence visible and identifies the information needed for a broader decision, rather than assuming that a favorable past return makes a larger weight automatically desirable.
A complete practice record: assumptions, calculation, and review
Start the exercise by copying its inputs into a short record before pressing Calculate. Identify every unit and denominator: dollars, shares, percentages, price units, or a count of completed observations. Write the valuation time and clarify whether the values are fictional, historical, or confirmed transactions. The defaults in this course are fictional teaching examples. Their purpose is to make the arithmetic reproducible, not to recommend a position, percentage, boundary, or financing arrangement for a particular person.
Name the assumption that has the greatest effect on the answer. In one exercise it may be an exit fill; in another it may be the portfolio value, a shared shock, a cost, or the definition of the risk unit. A precise result can be highly sensitive to one uncertain input. State that sensitivity in plain language rather than allowing a clean screen to imply certainty. The calculator can enforce numerical consistency, but it cannot verify that the source data or chosen policy fits a real account.
Predict the result of one controlled change before calculating again. Keep every other input fixed. Explain whether the change affects a numerator, denominator, quantity constraint, cost, or scenario branch. Then compare the displayed result with your prediction. If they differ, return to the definition and arithmetic before inventing a market explanation. This method teaches the relationship among the inputs and prevents experimentation from becoming a search for a reassuring output.
Test a boundary case deliberately. Ask what happens when no whole share fits, a denominator becomes zero, a list is incomplete, a quantity exceeds the holding, or a scenario no longer matches the required price ordering. A validation message is useful evidence about the model’s scope. Do not replace a rejected value with an unrelated number simply to obtain an answer. First identify the violated assumption and decide whether this exercise is the appropriate model for the question.
Keep intended actions separate from confirmed states. A submitted order is not a completed fill, a cancellation request is not necessarily a canceled instruction, and a chart reference is not an available transaction price. For a paper exercise, state the hypothetical execution assumption. For a completed transaction record, use actual quantities, prices, charges, and status. Reconcile partial fills and remaining instructions so the ledger describes the exposure that exists rather than the exposure that was intended.
Write both the ordinary scenario and an adverse alternative when the model permits it. Preserve the original quantity while testing a worse outcome unless the purpose is explicitly to design a new plan. Label any revised plan with its own time and assumptions. A stress case is one selected possibility; it is not automatically the worst conceivable outcome or an estimate of probability. Missing information should remain labeled as missing rather than being converted into a zero or a favorable assumption.
Review the result on two separate dimensions. The first is outcome: what net dollars or normalized result occurred under the stated convention? The second is process: were the original definitions, constraints, and reconciliation steps followed? A favorable outcome does not prove a deviation was sound, and a loss does not prove that correct arithmetic was wrong. This separation helps a beginner identify a specific improvement instead of responding to every result with a new rule.
Finish with a concise explanation containing the observation, calculation, interpretation, and limitation. Another reader should be able to reproduce the important numbers without guessing what the fields mean. Preserve the original record, later revisions, and unfavorable examples. If extending the exercise into a historical or forward paper study, define the eligible sample and review horizon before collecting outcomes. A selected group of attractive examples cannot establish the reliability of a process. The strongest learning result is a clearer, auditable decision routine, including a clear reason when an example remains unresolved or does not fit the entered constraints.
Sources and model scope
Primary investor-education background supplies additional context. The numerical cases, graphics, and worksheets here are original fictional teaching examples. Every calculation depends on its stated convention; no worksheet determines personal suitability, guarantees execution, or establishes future returns.