

Risk Management · Lesson 08 of 15 · Reviewed November 10, 2026
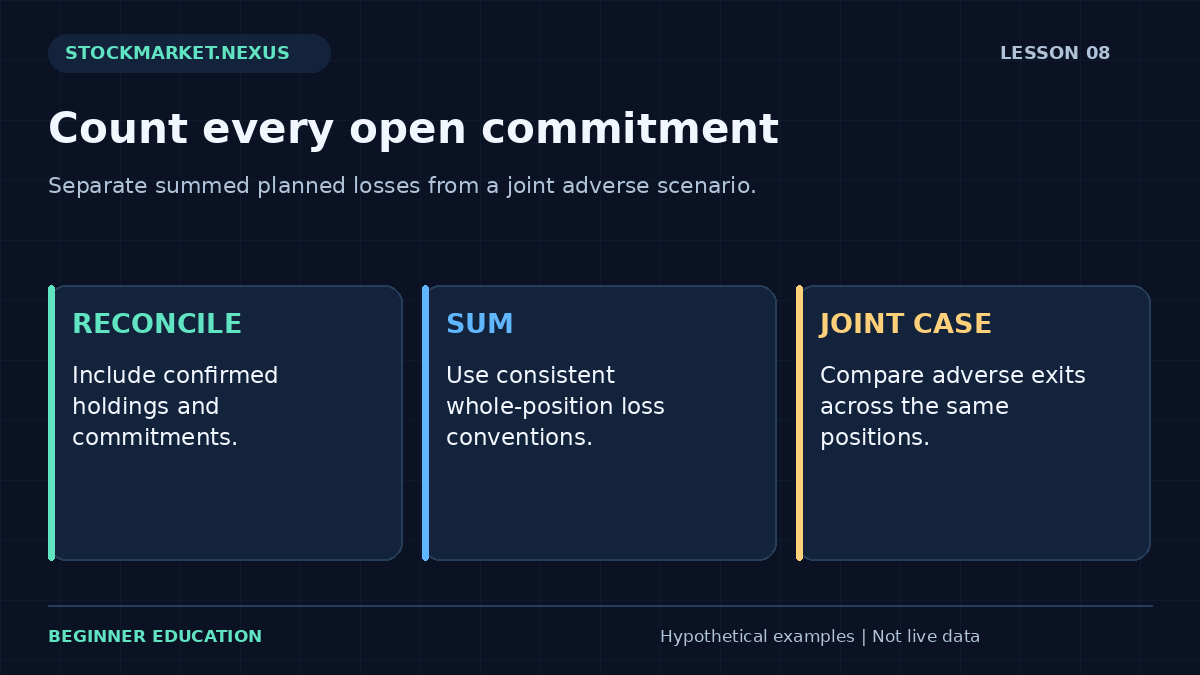
A portfolio can contain several positions that each look modest in isolation while creating a substantial combined scenario. Aggregate open-position risk asks what the existing commitments mean together. It begins with a consistent ledger and distinguishes summed planned losses from a separate joint stress case.
The dedicated exercise accepts aligned lists of planned loss magnitudes and stressed loss magnitudes for hypothetical positions, plus an equity reference and an entered aggregate boundary. It adds those scenarios and reports percentages. It does not estimate correlations, guarantee that exits occur as planned, or certify that the portfolio is diversified.
1. Define one consistent position-level convention
Before adding values, make sure each position’s planned loss uses the same scope. If one includes charges and another omits them, the total is inconsistent. If one uses entry-to-exit loss while another uses current-mark-to-exit loss, they answer different questions.
Both bases can be useful, but they should be kept in separate totals. Entry-to-exit measures the complete hypothetical trade result. Current-mark-to-exit measures an additional decline from a current valuation. Mixing them can make an aggregate number difficult to interpret.
This exercise assumes the supplied planned and stressed values are nonnegative whole-position loss magnitudes under one stated convention. It does not derive them from prices. The learner should preserve the calculation behind each input.
2. Include all relevant commitments
Open holdings are the starting point, but pending entry orders can become exposure later. Partial fills can leave both a holding and a remaining order. A complete operational review reconciles those states before reporting a current total.
Do not assume a cancellation request removed an order until its status is confirmed. Similarly, do not remove a position from the risk ledger because an exit was submitted but not completed. Intent and confirmed account state are different.
The stop-execution lesson explains this distinction. The aggregation worksheet is a snapshot based on entered positions; it cannot discover unrecorded holdings or pending instructions.

3. Sum planned scenarios without claiming a maximum
Suppose three positions have planned losses $80, $120, and $50. The total is $250. Against a $10,000 equity reference, that is 2.5%. The total describes the sum of the selected planned outcomes, not the worst possible portfolio loss.
If every actual exit matches its assumption and all relevant charges were included, those values describe the combined modeled loss. If several fills deteriorate, the total can be larger. A sum of conditional estimates remains conditional.
An entered aggregate boundary of $300 leaves $50 of arithmetic headroom under the planned scenario. That does not mean a new $50 proposal is automatically appropriate. Event overlap, cash, concentration, execution, and the broader policy still require review.
4. Add a joint stressed scenario separately
For the same three positions, suppose stressed losses are $180, $250, and $90. The joint stressed total is $520, or 5.2% of the equity reference. It exceeds the $300 boundary by $220 even though the planned sum fits.
The tool requires each stressed magnitude to be at least its paired planned magnitude for this adverse-scenario exercise. The positions remain aligned by list order. A different scenario could include gains in some holdings, but that would need a signed portfolio-return model rather than this loss-only comparison.
The stressed total is one selected case, not an estimated probability or a worst-case guarantee. Its usefulness comes from showing how much the conclusion depends on the planned exit assumptions.
5. Distinguish aggregation from diversification analysis
Adding planned losses does not measure statistical dependence. Two portfolios with the same planned sum can have different economic drivers and different behavior during an event. A collection of many tickers can still share one dominant sector or issuer exposure.
The concentration lesson examines the value distribution across holdings. The joint-stress lesson applies aligned signed shocks. These are complementary questions rather than competing ways to produce one universal risk score.
Avoid giving diversification credit simply because position labels differ. If several holdings respond to the same announcement, their protective assumptions may deteriorate together. A review should identify shared drivers before assuming losses will offset.
6. Use the dedicated aggregation exercise
Open the Lesson 8 aggregate-risk exercise. Enter planned losses 80, 120, 50; stressed losses 180, 250, 90; equity 10000; and boundary 300. Predict totals 250 and 520, percentages 2.5% and 5.2%, and planned headroom 50.
Increase only the second stressed loss to 400. The planned total remains unchanged while the joint stressed total rises to 670. This isolates sensitivity to one adverse assumption. Next add a fourth position to both lists and observe the new totals.
The lists must have equal length. A missing stressed value should produce an error rather than silently treating the omitted position as zero. This validation is a useful reminder that incomplete records can make an aggregate dashboard look safer than the portfolio it describes.
7. Keep the equity denominator consistent
The same $250 planned sum is 2.5% of $10,000 and 3.125% of $8,000. A changing account reference can therefore alter relative exposure even when the holdings are unchanged. Record the valuation time and whether equity includes open marks and debt.
A raw account balance may not represent net equity if borrowing or liabilities exist. A cash-only amount may omit securities. The denominator should match the question and be reconciled to the account convention before interpreting the percentage.
The leverage lesson traces assets, debt, and equity explicitly. Aggregating losses against an incorrect denominator can understate the impact of a common adverse move.
8. Reconcile changes rather than editing the total blindly
When a position partially exits, update its remaining quantity and scenario calculation. When an exit completes, move the realized result to the appropriate ledger and remove the corresponding open commitment. Preserve an audit trail so the same exposure is neither omitted nor counted twice.
A reference change also changes the total. If an invalidation level is widened, the planned loss can rise without any new purchase. A portfolio review should detect that increase rather than treating the absence of a new order as proof that exposure stayed fixed.
A useful journal records the reason for each revision: fill, quantity, price reference, charges, or event scenario. The final aggregate number is easier to trust when its components can be explained.
9. Case review: several small plans share one event
Three fictional positions have planned losses totaling $250, each individually below a chosen position-level allowance. All are exposed to the same industry announcement. A joint adverse case produces losses $180, $250, and $90, totaling $520. Position-by-position compliance did not describe the combined event exposure.
The example does not require a measured correlation coefficient to be useful. It asks what happens under one explicit shared shock. A probability estimate would be a separate and more demanding claim.
For practice, list the common drivers next to the position values and scenario losses. Then explain which controls operate at the position level and which operate at the portfolio level. This distinction makes aggregation more than a sum: it becomes a structured way to identify where several reasonable-looking assumptions can fail together.
Review challenge: one position changes without a new purchase
Three planned loss magnitudes are $80, $120, and $50. The total is $250. A learner widens the second position’s exit assumption so its planned loss becomes $190. The new aggregate is $320 even though no shares were added. Exposure changed because a reference changed.
If the entered boundary is $300, the revised planned sum now exceeds it by $20. The original total should remain in the journal with the reason and time of the revision. Reporting only the absence of new orders would miss the actual change in the scenario.
Next suppose the first position partially exits and its remaining planned magnitude falls to $40. The new sum becomes $280 after the quantity and charges are reconciled. A realized result from the sold portion belongs in the appropriate completed-trade ledger, not invisibly inside the open total.
For practice, identify whether each update came from quantity, price reference, charges, or a confirmed exit. Keep a component-level record so another reader can reproduce the aggregate. A single dashboard number is useful when it summarizes a trustworthy ledger; it is misleading when it hides inconsistent bases, missing positions, or unrecorded changes to the original plan.
A complete practice record: assumptions, calculation, and review
Start the exercise by copying its inputs into a short record before pressing Calculate. Identify every unit and denominator: dollars, shares, percentages, price units, or a count of completed observations. Write the valuation time and clarify whether the values are fictional, historical, or confirmed transactions. The defaults in this course are fictional teaching examples. Their purpose is to make the arithmetic reproducible, not to recommend a position, percentage, boundary, or financing arrangement for a particular person.
Name the assumption that has the greatest effect on the answer. In one exercise it may be an exit fill; in another it may be the portfolio value, a shared shock, a cost, or the definition of the risk unit. A precise result can be highly sensitive to one uncertain input. State that sensitivity in plain language rather than allowing a clean screen to imply certainty. The calculator can enforce numerical consistency, but it cannot verify that the source data or chosen policy fits a real account.
Predict the result of one controlled change before calculating again. Keep every other input fixed. Explain whether the change affects a numerator, denominator, quantity constraint, cost, or scenario branch. Then compare the displayed result with your prediction. If they differ, return to the definition and arithmetic before inventing a market explanation. This method teaches the relationship among the inputs and prevents experimentation from becoming a search for a reassuring output.
Test a boundary case deliberately. Ask what happens when no whole share fits, a denominator becomes zero, a list is incomplete, a quantity exceeds the holding, or a scenario no longer matches the required price ordering. A validation message is useful evidence about the model’s scope. Do not replace a rejected value with an unrelated number simply to obtain an answer. First identify the violated assumption and decide whether this exercise is the appropriate model for the question.
Keep intended actions separate from confirmed states. A submitted order is not a completed fill, a cancellation request is not necessarily a canceled instruction, and a chart reference is not an available transaction price. For a paper exercise, state the hypothetical execution assumption. For a completed transaction record, use actual quantities, prices, charges, and status. Reconcile partial fills and remaining instructions so the ledger describes the exposure that exists rather than the exposure that was intended.
Write both the ordinary scenario and an adverse alternative when the model permits it. Preserve the original quantity while testing a worse outcome unless the purpose is explicitly to design a new plan. Label any revised plan with its own time and assumptions. A stress case is one selected possibility; it is not automatically the worst conceivable outcome or an estimate of probability. Missing information should remain labeled as missing rather than being converted into a zero or a favorable assumption.
Review the result on two separate dimensions. The first is outcome: what net dollars or normalized result occurred under the stated convention? The second is process: were the original definitions, constraints, and reconciliation steps followed? A favorable outcome does not prove a deviation was sound, and a loss does not prove that correct arithmetic was wrong. This separation helps a beginner identify a specific improvement instead of responding to every result with a new rule.
Finish with a concise explanation containing the observation, calculation, interpretation, and limitation. Another reader should be able to reproduce the important numbers without guessing what the fields mean. Preserve the original record, later revisions, and unfavorable examples. If extending the exercise into a historical or forward paper study, define the eligible sample and review horizon before collecting outcomes. A selected group of attractive examples cannot establish the reliability of a process. The strongest learning result is a clearer, auditable decision routine, including a clear reason when an example remains unresolved or does not fit the entered constraints.
Sources and model scope
Primary investor-education background supplies additional context. The numerical cases, graphics, and worksheets here are original fictional teaching examples. Every calculation depends on its stated convention; no worksheet determines personal suitability, guarantees execution, or establishes future returns.