

Day Trading · Lesson 14 of 15 · Reviewed November 9, 2026
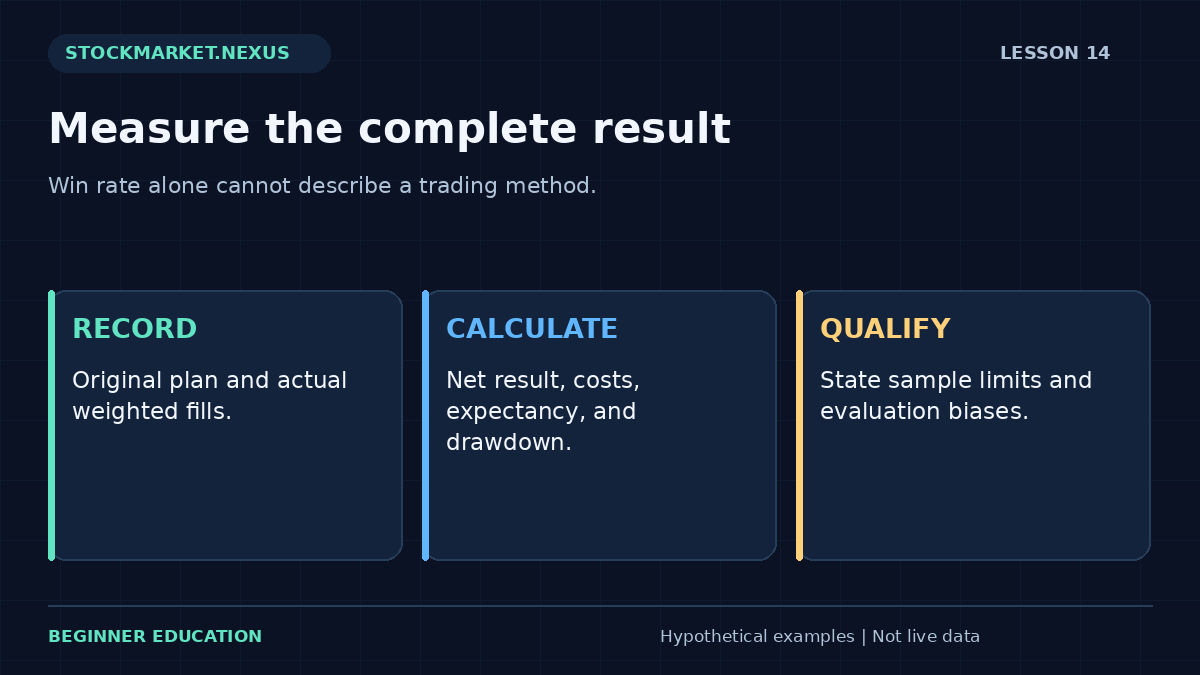
A trading record should explain how results were produced, not merely display a winning percentage. Two methods can have the same win rate and very different net outcomes because their gains, losses, costs, and exceptional events differ. A screenshot of the best trade cannot establish what happened across the account or whether the process can be repeated.
This guide builds a review framework using fictional results. It explains the arithmetic and the limits of conclusions drawn from small or selectively recorded samples. It does not certify a strategy or predict future returns. The objective is a record that can expose operational mistakes, unrealistic assumptions, and evidence that a hypothesis should be revised or rejected.
1. Preserve the original decision before the result
Record the instrument, timestamp, setup version, conditions, entry assumption, intended exit, quantity, costs, and reason to pass. Keep the plan as it existed before the outcome. A final chart with ideal arrows added afterward contains information that was unavailable when the decision occurred.
Then add confirmed or modeled fills separately. Requested quantity is not the same as executed quantity, and a chart touch does not establish a limit fill. Record partial executions, cancellations, rejected instructions, and no-fills. These operational events affect what the account actually experienced.
The daily-routine lesson explains where documentation belongs in the session. A journal that begins only after an emotionally memorable trade is vulnerable to selection. Consistent recording makes ordinary losses and unexciting passes visible alongside attractive winners.
2. Separate process adherence from financial outcome
Create one field for the result and another for whether the written rules were followed. A profitable quantity error is still an error. A losing trade that met the method's conditions is a different observation. Combining them under good trade and bad trade obscures the cause of improvement or failure.
Use specific deviation labels: late entry, incorrect quantity, missing event check, changed exit, duplicate instruction, or unresolved order status. “Lack of discipline” is too broad to suggest a concrete correction. A precise label can lead to a specific control in the next version of the routine.
Do not exclude deviations from the account's actual financial record. You may analyze eligible strategy trades separately, but retain the complete account outcome and clearly state which subset is being studied. Otherwise, the method can appear profitable while the real implementation repeatedly loses money through mistakes that have been omitted.
3. Calculate net results consistently
For a simple completed long-stock trade, gross price result is quantity multiplied by sale price minus purchase price, using actual weighted executions. Subtract applicable explicit charges and other relevant costs according to a stated method. Spread effects already embedded in fills should not be deducted a second time.
If purchases or sales occur in multiple lots, calculate the quantity-weighted amounts. Selling 40 shares at $41 and 60 at $40.50 produces $4,070, not the proceeds implied by an equally weighted average of the two prices. The number of shares at each price matters.
Separate recurring expenses from transaction-specific charges. A monthly data subscription can affect the activity's economics even if it does not change one fill. State how it is treated in the review. Deposits and withdrawals also need their own ledger so additional capital is not mistaken for trading profit.
4. Understand win rate without overvaluing it
Win rate is the fraction of completed observations classified as winners under a stated definition. Define the treatment of breakeven trades, partial positions, and multiple exits. Different grouping conventions can produce different percentages from the same transaction history.
A method winning eight of ten trades can still lose overall if the two losses are large. A method winning fewer trades can have a positive sample result if its gains are sufficiently larger than its losses. Neither statement predicts future behavior; it explains why frequency alone is incomplete.
Avoid publishing a percentage without the sample size, period, costs, and selection rules. Ten trades and a thousand trades provide different amounts of evidence, and even a large historical sample can be unrepresentative of future conditions. A precise percentage should not create a false impression of certainty.
5. Work through sample expectancy
A common sample expectancy calculation is win frequency multiplied by average win, minus loss frequency multiplied by average loss, with costs treated consistently. It summarizes observed outcomes under the chosen grouping. It is not a guaranteed expected return for the next trade.
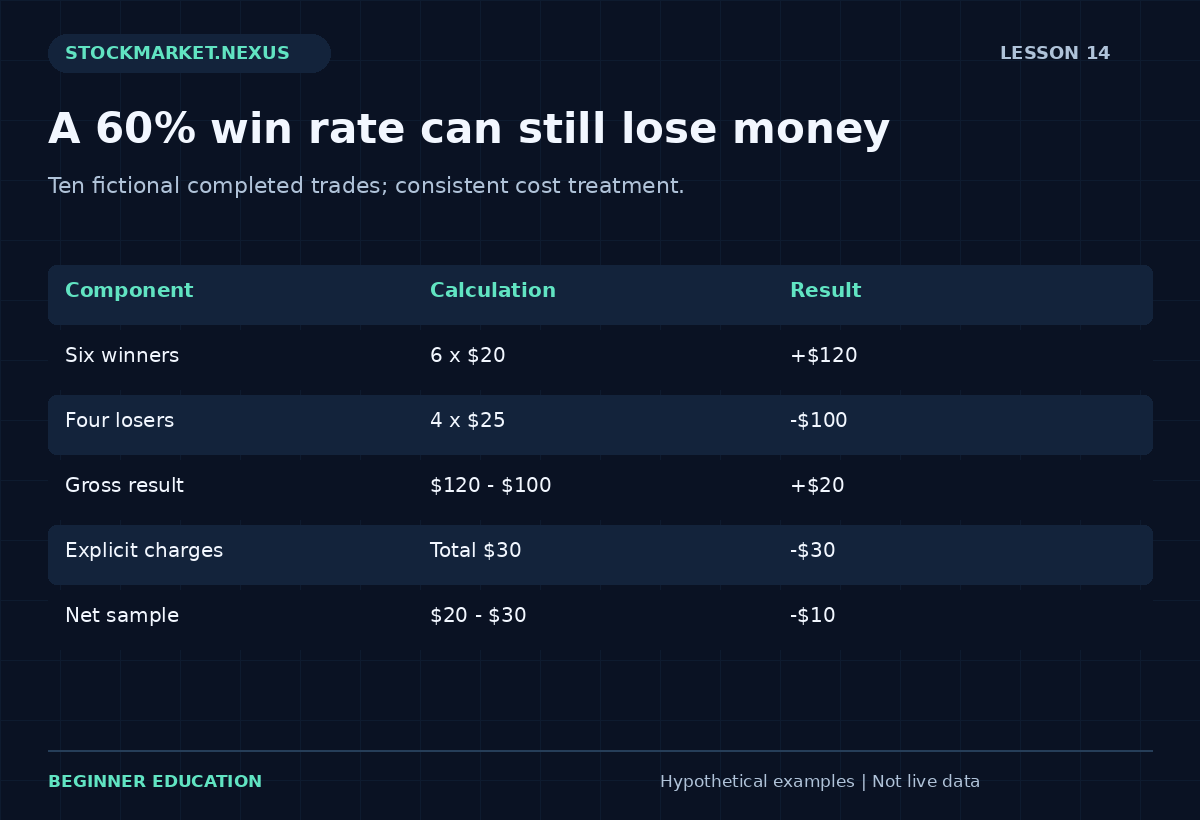
Suppose six fictional winners average $20 and four losers average $25. Gross gains total $120, gross losses total $100, and the ten-trade gross result is $20. If total applicable charges are $30, the net result is minus $10, or minus $1 per trade. A sixty-percent win rate did not create a positive net sample.
State whether average wins and losses are already net of costs. If they are, subtracting the same charges again is incorrect. If not, leaving charges out exaggerates the result. Accurate definitions matter more than choosing the formula that produces the most attractive headline.
6. Measure outcomes in risk units carefully
Some traders express a result relative to an initial planned price-risk amount, often called one R. If the initial amount is $25 and the completed net loss is $50, the result is minus two R under that convention. Define whether the denominator includes costs and whether the numerator is gross or net.
The initial planned amount should remain fixed for the review. Increasing it after a loss makes the same outcome appear smaller in R terms. Likewise, a stop that executes worse than intended can produce a loss larger than one R. That is a meaningful observation, not an arithmetic error to hide.
The intraday risk-planning guide explains why planned loss is not a guaranteed maximum. Risk-unit reporting can help compare differently sized trades, but it cannot erase the financial importance of actual dollars, cash commitment, concentration, and account affordability.
7. Track drawdown from a previous peak
Drawdown measures a decline from a prior high in the selected account or strategy series. Specify whether the series includes open-position marks, only closed trades, fees, deposits, and withdrawals. Different conventions can produce different values. A review should make the choice explicit.
If a fictional account peaks at $5,000 and later reaches $4,500, the decline is $500 or ten percent of the peak. Recovering to $5,000 requires about 11.11 percent from the lower value. A strategy can have a positive final result while still experiencing a decline that is financially or emotionally unmanageable.
Do not report only the final balance. The path matters because it affects capacity to continue and behavior under pressure. A method that depends on tolerating losses the user cannot absorb is not made suitable by an attractive ending point in a historical example.
8. Inspect concentration and exceptional trades
Check whether a small number of trades or sessions account for most of the gain. An unusually favorable event can dominate a short sample. Removing it for analysis does not mean it should be erased from the actual record; it means you are studying how sensitive the conclusion is to an exceptional observation.
Also group results by setup, session, instrument type, event context, and rule version where the sample supports it. Avoid creating so many categories that every subgroup becomes too small to interpret. A pattern found after extensive searching can reflect chance rather than a durable relationship.
The news and event-risk lesson explains why event exposure should be labeled. A method that works only during one unusual market period may not behave similarly elsewhere. The conclusion should acknowledge that limitation rather than treating every observed gain as evidence of the entry rule alone.
9. Recognize common evaluation biases
Selection bias appears when only attractive instruments or successful examples are retained. Look-ahead bias appears when a decision uses information not yet available at its timestamp. Survivorship issues can arise when the universe excludes securities that later disappeared or became difficult to trade. Unrealistic fills can add another distortion.
Overfitting can occur when many rules are adjusted to improve the same historical sample. Even a complicated method can fit noise. Keep exploratory development separate from a fresh evaluation period, retain previous versions, and document how many alternatives were considered. A backtest is only as meaningful as its assumptions and data.
Simulation adds its own limitations. Fills, liquidity, costs, and emotions may differ from live conditions. The paper-trading foundation guide explains why a simulator can teach mechanics without proving future profitability. Label simulated results honestly rather than presenting them as verified live performance.
10. Turn the review into one specific improvement
Begin with the largest clear problem. If quantities are frequently wrong, improve the order check before adding a new indicator. If costs overwhelm small targets, reconsider execution assumptions. If eligible setups lose consistently under realistic conditions, the strategy hypothesis may need revision or rejection.
Make a dated change and state the reason. Preserve the earlier record so the next review can compare like with like. Changing several variables at once makes it difficult to identify what mattered. Repeatedly rewriting old rules also undermines confidence that the history describes the method actually followed.
Set a review schedule that allows reflection outside live decisions. A single uncomfortable trade is weak evidence for a wholesale redesign. A collection of consistent observations can support a narrower conclusion. Professional review includes the possibility that the appropriate next step is more simulation, a simpler routine, or no active trading.
Worked ten-trade review worksheet
Create a fictional table with six $20 gross gains and four $25 gross losses. Add $3 of charges to each completed trade. Calculate gross result, total charges, net result, win rate, average net result, and the largest decline in the chosen cumulative series. State the trade ordering because the drawdown depends on the path.
Next label two trades as process deviations without deleting them. Compare the complete account result with the eligible-strategy subset and explain the difference. Then add a no-fill observation and show why it should not be counted as a completed winner simply because the later chart moved favorably.
Finally, write a conclusion with limits: what the sample demonstrates, what it does not, and what would be needed for a stronger evaluation. The exercise is successful when the accounting and uncertainty are clear, not when a favorable statistic can be extracted from the table.
Compare two samples with the same win rate
Sample A contains six $20 gains and four $25 losses before costs. Its gross result is $20. Sample B also contains six winners and four losers, but winners average $10 and losers average $30. Its gross result is minus $60. Both have a sixty-percent win rate, yet their financial outcomes differ substantially.
Apply the same hypothetical $30 total charges to each. Sample A becomes minus $10 net, and Sample B becomes minus $90 net. The common percentage does not summarize outcome size or friction. If a report presents only the win rate, it omits information necessary to interpret the result.
Now change the order of the trades without changing their amounts. The final result remains the same, but the path and maximum drawdown can change. Consecutive early losses may create a different experience from losses dispersed among gains. Preserve the sequence when studying the capacity to follow a method. Performance is not only a final total; it includes the route through uncertainty that an actual account and person would have to tolerate.
Frequently asked questions
Is a high win rate enough to trust a method?
No. Gain and loss sizes, costs, drawdown, selection, and sample quality all matter. A high percentage can coexist with a negative net result or occasional losses too large for the account. Evaluate the full distribution rather than one appealing metric.
How many trades prove profitability?
There is no universal number that proves future performance. Evidence depends on consistency, independence, market coverage, assumptions, and the size of uncertainty. More observations can help, but biased data and unrealistic fills do not become valid simply because the sample is large.
Should losing mistakes be removed from the record?
Keep them in the actual account history. You can analyze a clearly labeled subset to study the intended strategy, but implementation errors remain part of real economics. Omitting them without explanation can make an impractical method look better than the experience of following it.
Practice and official background
Use the Day Trading Practice Lab to observe fictional cash, fills, fees, and realized outcomes. Its replay is a learning model, not a backtest certification. For execution context, consult the SEC order-execution guide.